Figure 1.
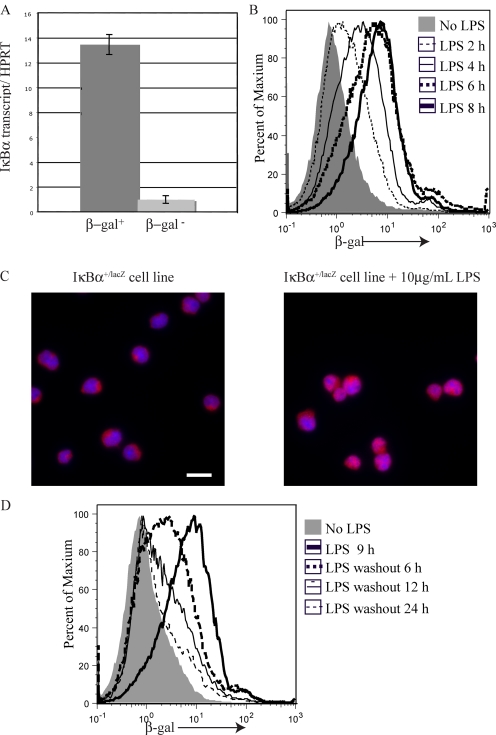
IκBα+/lacZ mouse reports IκBα transcription and nuclear NF-κB activity. (A) Real-time RT-PCR analysis of IκBα expression in RNA purified from flow-sorted β-gal+ (dark gray) and β-gal− (light gray) IκBα+/lacZ pre–B cells (B220+CD43lowsIgM/D−). The ratio is shown between IκBα transcript and a control transcript, HPRT, with error bars indicating the standard deviation of triplicate assays. (B) Flow cytometric analysis of β-gal expression in IκBα+/lacZ Ableson cells cultured in the absence (gray shading) or presence of LPS for the indicated lengths of time. (C) Anti-p65 immunofluorescence microscopy was performed on IκBα+/lacZ Ableson cells cultured in the presence (right) or absence (left) of LPS for 2 h. Bar, 10 µm. (D) Flow cytometric analysis of β-gal expression in IκBα+/lacZ Ableson cells cultured in the absence (gray shading) or presence (thick black line) of LPS for 9 h, or after the indicated times after the LPS had been washed out and the cells had been recultured with cycloheximide. Each of the experiments in A–C were repeated a minimum of twice with similar results.

