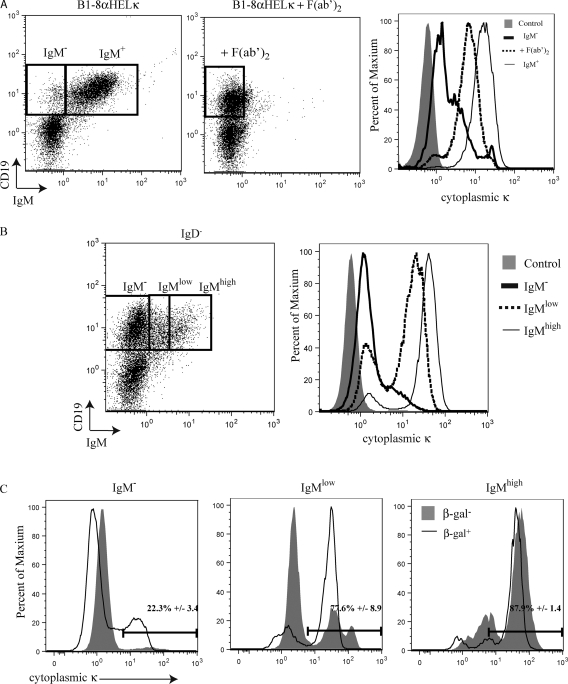
Figure 4.
Cytoplasmic κ expression correlates with IκBα expression. (A) B1-8 α-HEL-κ bone marrow was cultured in IL-7 with or without cross-linking with anti-IgM F(ab′)2 to imitate a receptor-editing signal. Cells were surface stained with anti-CD19 and anti-IgM antibodies and a fourfold excess of a biotinylated anti-Igκ antibody to block surface Igκ. Cells were fixed, permeabilized, and stained with anti-Igκ antibody. The dot plots show CD19 versus IgM. The histogram displays cytoplasmic κ staining with the shaded gray representing isotype control staining, the thick black line representing IgM− cells without cross-linking, the dashed line representing cells cross-linked with anti-IgM F(ab′)2, and the thin black line representing IgM+ cells without cross-linking. This experiment was repeated three times. (B) Bone marrow from a wild-type mouse was stained as described in A. The dot plots show CD19 and IgM staining with gates defining IgM−, IgMlow, and IgMhigh populations. The histograms display cytoplasmic κ expression. The shaded gray indicates isotype control, the thick black line indicates IgM−, the dashed line indicates IgMlow, and the thin black line indicates IgMhigh. This experiment was performed three times with bone marrow from different individual mice. (C) IκBα+/lacZ bone marrow was sorted for β-gal expression and subsequently stained as described in A. The histograms display cytoplasmic κ expression in β-gal–sorted cells gated on the IgM−, IgMlow, and IgMhigh populations. β-gal–positive cells are indicated by the black lines and β-gal–negative cells are shown in gray shading. The numbers indicate the percentage of cytoplasmic κ–positive β-gal–positive cells, with mean values and standard error generated from analyses of three different mice.

