Figure 2.
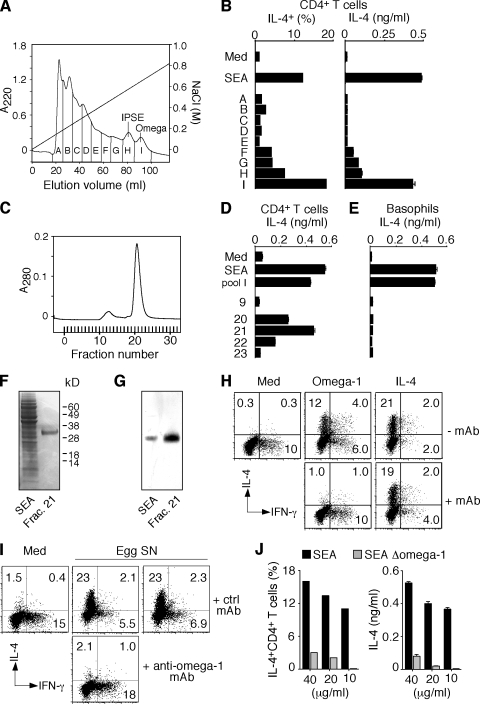
Identification of omega-1 as the major component with Th2-inducing activity in SEA. (A) The elution profile of SEA from an SP-Sepharose column indicating the pools (pools A–I) tested for biological activity. The diagonal line indicates the gradient of NaCl. (B) Th2 response of DO.11.10 Tg cells induced by the different pools in A was measured by ICS and IL-4 secretion. The results from an assay performed at one fixed protein concentration (20 µg/ml) for each pool are shown, along with 40 µg/ml SEA as a positive control. Bars represent the percentage of IL-4+ CD4+ T lymphocytes, and the means ± SD of the IL-4 concentrations. The same pattern of activity was observed when three additional twofold serial dilutions were compared for each pool (not depicted). (C) The elution profile of pool I after separation on a Superdex 75 gel filtration column. (D and E) The indicated fractions were tested in Th2 polarization (D) and basophil (E) assays. Bars represent means ± SD for IL-4 measured by ELISA. (F) Coomassie blue–stained SDS-PAGE of SEA and fraction 21 from the column in C. (G) Western blot of SEA and fraction 21 developed with mAb specific for omega-1. (H and I) Flow cytometry of ICS performed on DO.11.10 Tg T cells stimulated with OVA/DCs in the presence of omega-1 or IL-4 preincubated with or without anti–omega-1 mAb (H) or in the presence of egg supernatants preincubated with control or anti–omega-1 mAb (I). The dot plots are gated on CD4+ T lymphocytes (percentages are shown). (J) Loss of Th2 activity in SEA depleted of omega-1 measured by ICS and IL-4 secretion in a DO.11.10 Tg T cell assay as described. The experiments shown in A–G and H–J are representative of two and three experiments, respectively.

