Figure 5.
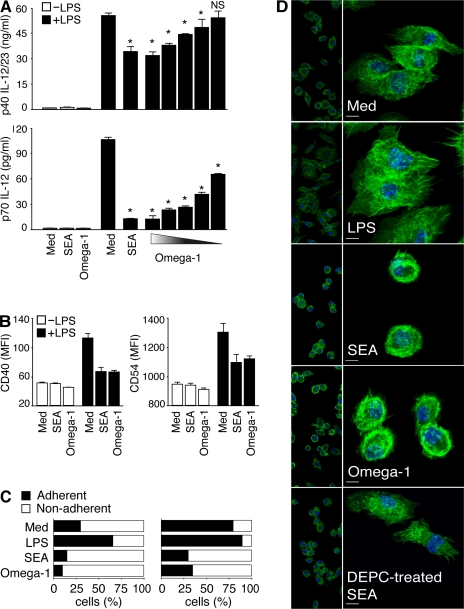
Omega-1 suppresses TLR ligand–mediated DC activation and induces cytoskeletal changes in DCs. (A and B) BMDCs were incubated in medium, 40 µg/ml SEA, or 1 µg/ml omega-1 with or without 40 ng/ml LPS. (A) Levels of p40 IL-12/23 and p70 IL-12 measured by ELISA. When tested in the presence of LPS, twofold dilutions of omega-1 (1–0.06 µg/ml) were assayed. Bars represent mean cytokine concentrations ± SD. *, P < 0.05; and NS refer to IL-12 secretion induced by LPS alone versus in the presence of SEA or omega-1. (B) Surface expression of CD40 and CD54 on DCs in the same cultures. Bars represent geometric mean fluorescences ± SD of two experiments. (C and D) BMDCs were cultured in medium, 40 ng/ml LPS, 40 µg/ml SEA, or 0.5 µg/ml omega-1 for 12 h. (C) The number of viable cells was determined in adherent versus nonadherent populations after culture on nontreated (left) or tissue culture–treated (right) plates. Bars indicate the frequency of cells in the two subpopulations for each culture condition. Results are from one representative experiment out of three performed. (D) CD11c+ BMDCs cultured on multichamber glass slides under the same conditions were stained with phalloidin (green) and DAPI (blue) and analyzed by confocal microscopy. (left) Images demonstrate the homogeneity of cell populations; (right) A zoom-in view, which is a projection of a z-stack. The photomicrographs shown are representative images from five fields examined in one experiment out of three performed. Bars, 5 µm. MFI, mean fluorescence intensity.

