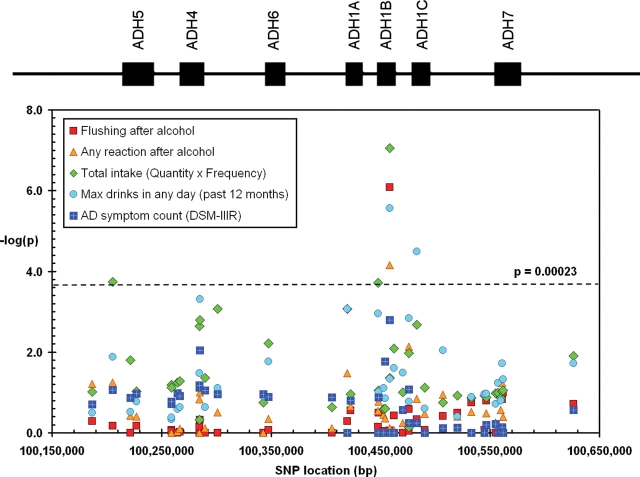
Figure 2.
Total association of SNPs across the ADH gene cluster with quantitative AD variables, alcohol consumption variables and self-reported alcohol reactions. The location of the seven ADH genes is shown at the top of the figure. Results are plotted as –log10(P-value) against the physical location of each SNP on chromosome 4. See Table 1 for further description of the variables.

