
Figure 3.
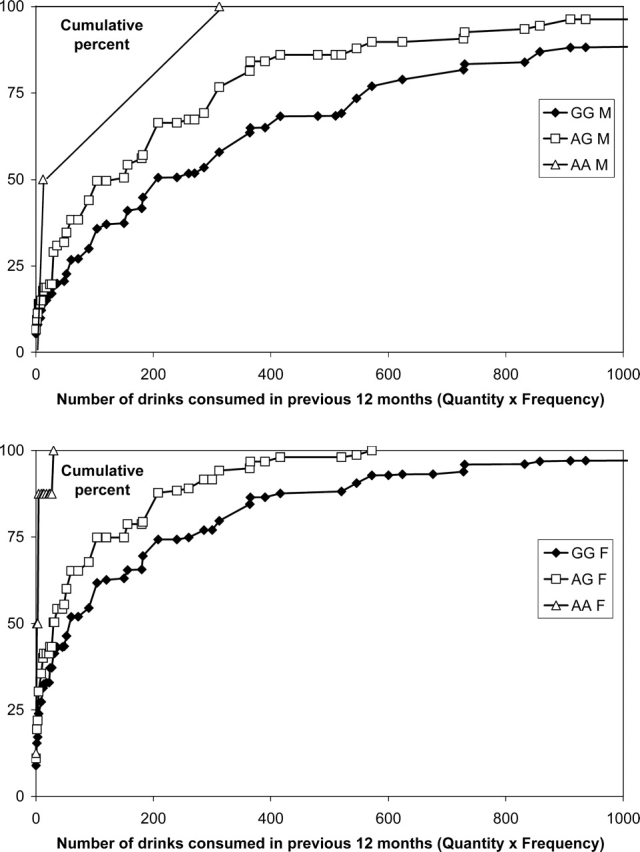
Cumulative frequency distribution plots for number of drinks in the previous 12 months (estimated from self-reported frequency and quantity) by rs1229984 (ADH1B Arg48His) genotypes, in (A) men and (B) women (GG = 48Arg homozygotes, AG = heterozygotes, AA = 48His homozygotes).