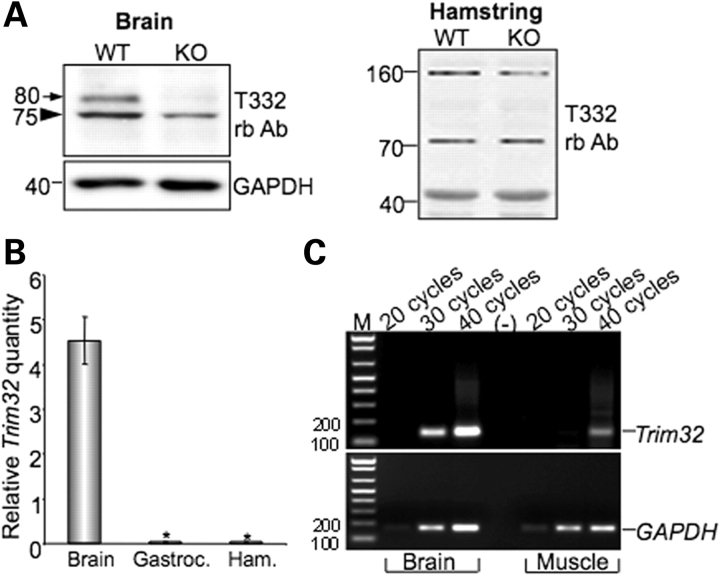
Figure 5.
TRIM32 expression in brain and skeletal muscle. (A) Western blot analysis of brain and skeletal muscle (hamstring) lysates using T332 antibody. The 80 kDa band in brain lysate is absent in T32KO, but the 72 kDa band in muscle persists in the T32KO. Anti-GAPDH staining is shown for loading control. (B) Real-time PCR data as Trim32 relative quantity normalized to GAPDH demonstrate a greater than 100-fold difference in Trim32 expression between brain and skeletal muscles (gastroc.: gastrocnemius and ham.: hamstring groups of muscles). Samples from three different WT animals were analyzed. Each sample was run in triplicate for both Trim32 and GAPDH amplifications, *P < 0.05. (C) Regular PCR using real-time PCR primers and different number of cycles is shown to visualize the real-time PCR data. Trim32 PCR band in muscles is detected only after 40 cycles of amplification, whereas in brain it can be observed after 30 cycles. GAPDH PCR used as a control shows approximately equal amount of cDNA in brain and muscle samples. M: markers (DNA ladder). Lane (–) is a negative control in which no DNA was added into the PCR.

