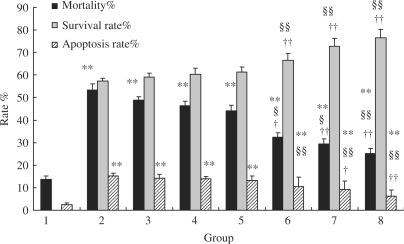
Figure 2.
Comparison of cell mortality, cell survival rate, cell apoptosis rate (n = 8). Group 1, Normal medium; 2, Aβ model; 3, +5% control serum; 4, +10% control serum; 5, +20% control serum; 6, +5% prepared serum; 7, +10% prepared serum; 8, +20% prepared serum. The data were presented as mean ± SD. The rate was presented as percentage. Compared with normal medium group, *P < 0.05, **P < 0.01. Compared with Aβ model group, §P < 0.05, §§P < 0.01. Compared with related control serum group, †P < 0.05, ††P < 0.01.

