
Figure 4.
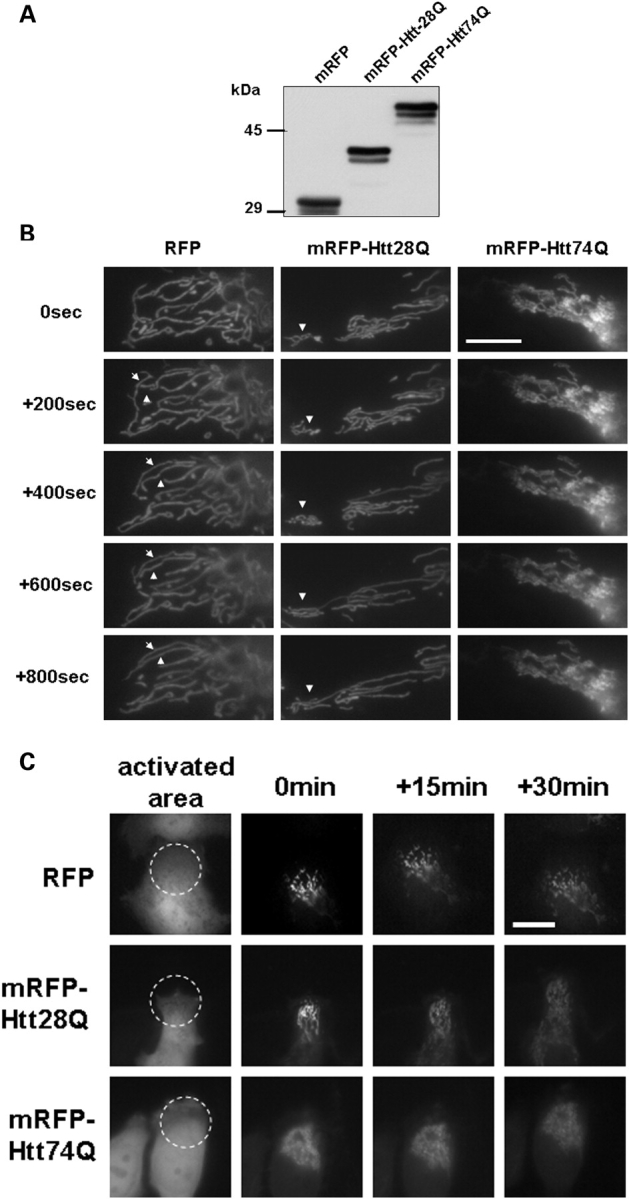

Mitochondrial dynamics in living cells analyzed using GFP photoactivation and time-lapse microscopy. HeLa cells were co-transfected with a mitochondrial matrix targeted photoactivable GFP (mito-PAGFP) and mRFP, or mRFP-Htt28Q or mRFP-Htt74Q expression plasmids. After 24 h transfection, cells were subjected to photoactivation studies, or lysates were prepared from the cells for immunoblot analysis. (A) Expression of mRFP, mRFP-Htt28Q and mRFP-Htt74Q proteins detected by immunnoblotting proteins lysates from the transfected cells with a rabbit polyclonal anti-RFP antibody. (B) Mitochondria in cells expressing mRFP or mRFP-Htt28Q proteins display more dynamic movement and fusion compared with cells expressing mRFP-Htt74Q protein. HeLa cells that had been co-transfected with mito-PAGFP and mRFP, or mito-PAGFP and mRFP-Htt28Q, or mito-PAGFP and mRFP-Htt74Q were imaged under a fluorescent microscope using a 100× objective lens and those displaying RFP fluorescence were targeted for photoactivation of the co-transfected mito-PAGFP protein by illumination with 405 nm light, and then GFP fluorescence images were captured over the indicated time intervals. Arrowheads point to the mitochondria that fused with one another in the time period shown. Please note that in the GFP-Htt74Q transfected cell, mitochondria were smaller, clustered, lacked dynamic movement and fusion events were very infrequent. (C) Same as in (B), except that the images shown were captured using a 40× objective. The left-hand panels show the mRFP fluorescence seen in a group of cells and the region (indicated by the circle) that was illuminated with 405 nm light to photoactivate the co-expressed PAGFP-mito protein in the various transfected cells. The subsequent GFP fluorescence images captured at 0, 15 and 30 min after GFP photoactivation are shown on the right of the RFP fluorescence image captured for each construct. (D) Quantification of the changes in GFP fluorescence intensity over time in cells transfected with the different mRFP-tagged expression constructs. GFP fluorescence was measured at 0, 15 and 30 min after photoactivation in the photoactivated (a, b and c) and non-activated regions (e, f and g, respectively) in cells transfected with mRFP or mRFP-Htt28Q or mRFP-Htt74Q expression constructs, respectively. The plots depict the results obtained in 10 independent experiments (each shown with a different color). Note that GFP fluorescence in the photoactivated regions, in general, decreases faster in the cells expressing either mRFP, or mRFP-Htt28Q proteins, compared with those expressing mRFP-Htt74Q protein. These changes were accompanied by a gradual increase in GFP fluorescent intensity in the non-activated regions of cells expressing either mRFP or mRFP-Htt28Q proteins, but remained relatively constant in cells expressing mRFP-Htt74Q. These results are consistent with the idea that mitochondria in cells expressing either the mRFP or the mRFP-HttQ28 proteins exhibit greater mitochondria fusion than cells expressing the mRFP-HttQ74 protein.