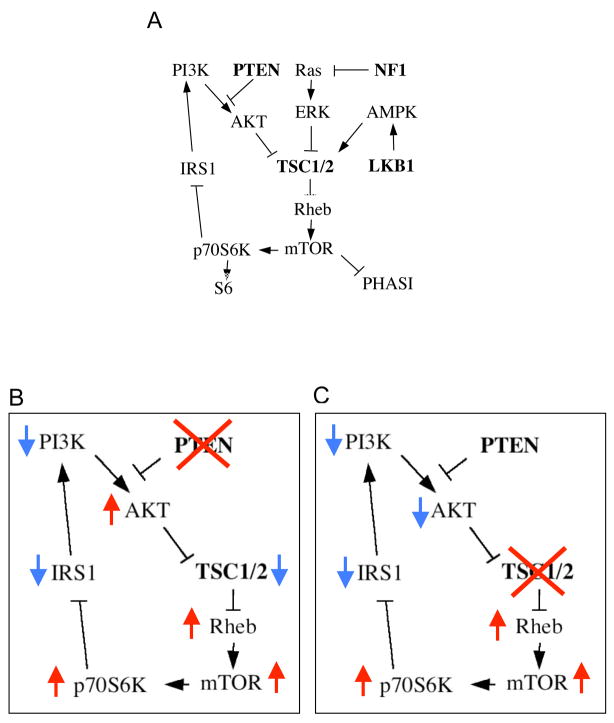
Figure 1.
The TSC/mTOR signaling pathway. A) PI3K-dependent activation of AKT leads to the inhibition of TSC2 activity resulting in an increase in Rheb-GTP level and downstream activation of mTOR, which in turn phosphorylates p70S6K and PHASI to promote protein synthesis. LKB1 phosphorylates AMPK to enhance TSC1/2 inhibition of mTOR. Acting down-stream of Ras, ERK and RSK phosphorylates TSC2 to repress its GAP activity. In a negative feedback loop, p70S6K phosphorylates IRS1 to reduce insulin sensitivity and AKT activity. Tumor suppressor genes that inhibit mTOR activity are in bold. B, C) Simplified versions of the pathway to highlight the functional consequences of the loss of PTEN (B) and TSC1/2 (C) are shown to illustrate the unique difference in AKT activity of the two scenarios. Arrows indicate relative change in activities.

