
Figure 7.
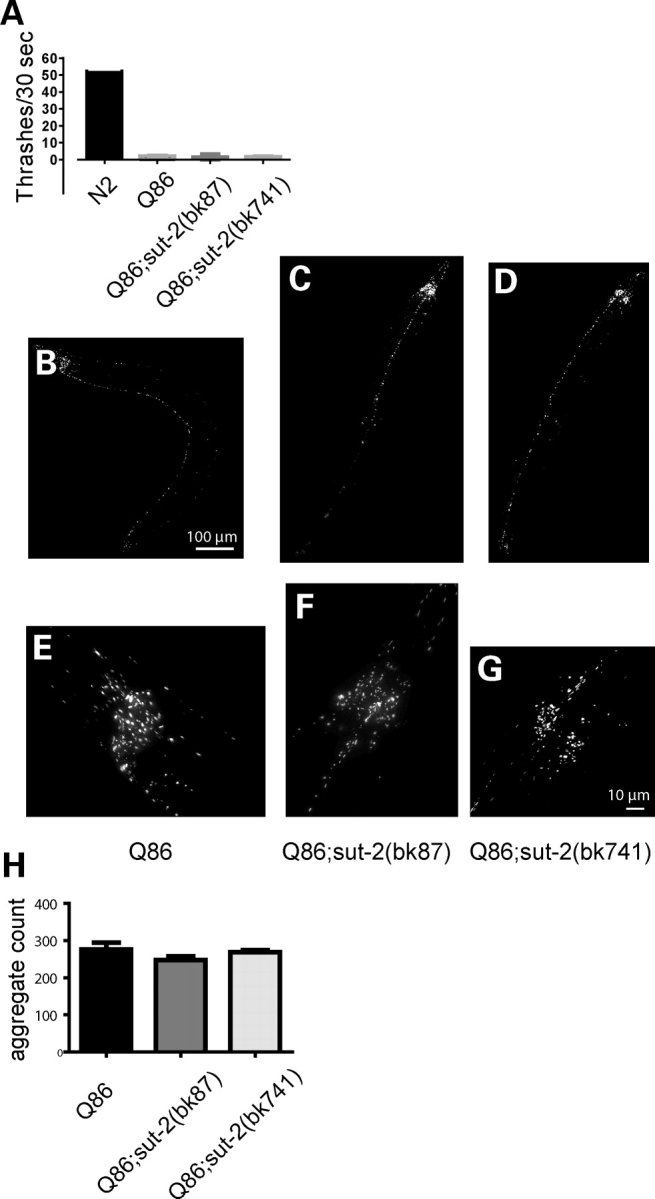
Loss of sut-2 does not modify polyglutamine phenotypes. (A) Graph of liquid thrashing assays for staged 4-day-old worms. Each column depicts the mean thrashing rate value (±SEM) for 20 worms: wild-type (N2)—52.6 ± 1.8, YFP-Q86—2.2 ± 0.4, YFP-Q86;sut-2(bk87)—1.6 ± 0.4 and YFP-Q86;sut-2(bk741)—1.9 ± 0.4; using the Kruskal–Wallis test, there are no statistically significant differences between YFP-Q86, YFP-Q86;sut-2(bk87) and YFP-Q86;sut-2(bk741) suggesting sut-2 does not modify the Q86 induced Unc phenotype. (B–G) Live image of polyQ aggregates of living worms. YFP-Q86 at low (B) and high magnification (E). YFP-Q86;sut-2(bk87) at low (C) and high magnification (F). YFP-Q86;sut-2(bk741) at low (D) and high magnification. (H) Graph of total number of YFP+ aggregates found per worm. Each data point represents the total number of YFP+ fluorescent polyQ86 deposits. The mean aggregate count (±SEM) for 10 worms scored: YFP-Q86–276 ± 19, YFP-Q86;sut-2(bk87)—247 ± 33 and YFP-Q86;sut-2(bk741)—269 ± 15. Using the Kruskal–Wallis test, there are no statistically significant differences between YFP-Q86, YFP-Q86;sut-2(bk87), and YFP-Q86;sut-2(bk741) suggesting sut-2 does not modify Q86 aggregate count.