Fig. 4.
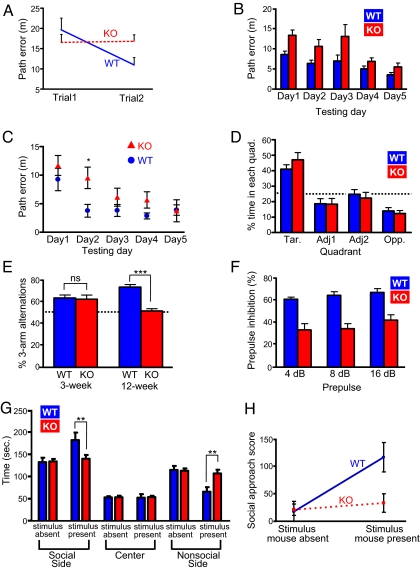
Behavioral phenotypes of KALRN-KO mice. (A) Two-trial matching-to-sample performance in the Morris water maze (MWM) shows that WT mice, but not KO mice, have a reduced path error on trial 2 relative to trail 1 (trial × genotype, P = 0.01). Data are means of each trial across 5 testing days. (B) MWM spatial reference memory (fixed platform test). Data are means of 6 trials for each day; main effects are observed for day and genotype (P < 0.001), but no effect of genotype by day (P > 0.05). (C) Additional analysis of MWM spatial reference memory. Means of trail 1 for each testing day; KO mice show an increased path error relative to WT mice on day 2 (*, P < 0.05), whereas performance between genotypes did not differ on any other days. (D) Water maze probe trail as a test of spatial reference memory shows the percentage of time animals search the target quadrant (Tar), the 2 adjacent quadrants (Adj1 and Adj2), and the quadrant opposite the target quadrant (Opp) for the removed platform. KO and WT mice spent a similar percentage of time searching in the target quadrant (P > 0.05). Line indicates chance level (25%). (E) Y-maze spontaneous alternation in 3- and 12-week-old KO and WT mice. Whereas the performance of 3-week-old KO and WT mice did not differ from each other, 12-week-old KO mice showed a deficit in spontaneous alternation relative to 12-week-old WT mice (***, P < 0.001). Line indicates chance performance (50%). Further analysis indicated a significant interaction of genotype by age (P < 0.001). (F) Prepulse inhibition: KO mice have a deficit in sensory motor gating across all prepulse intensities (P < 0.01). (G) Social behavior: In the presence of a stimulus mouse, KO mice spent less time in the social side and more time in the nonsocial side of the chamber relative to WT mice (**, P < 0.01); WT and KO mice show similar behavior in the absence of the stimulus mouse. (H) Additional testing for social behavior: social approach scores. Whereas WT mice show an increased social approach during the testing phase in which the stimulus mouse was present, relative to the habituation phase in which the stimulus mouse was absent, KO mice fail to show an increase in social approach between the 2 trials (P < 0.05). Data are mean ± SEM.

