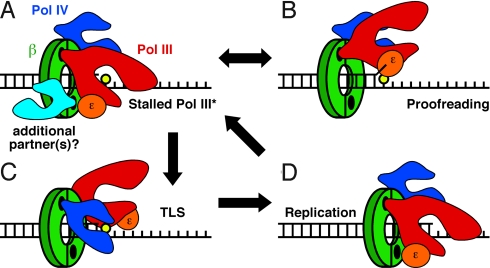
Fig. 5.
Model for the Pol III*/Pol IV switch. Pol IV is shown in dark blue, Pol III* is shown in red, its ε subunit is in orange, and a putative third Pol (or partner) is in light blue. For simplicity, our model does not depict the other Pol III* subunits, and represents a single DNA primer/template junction. See text for additional details regarding the model.

