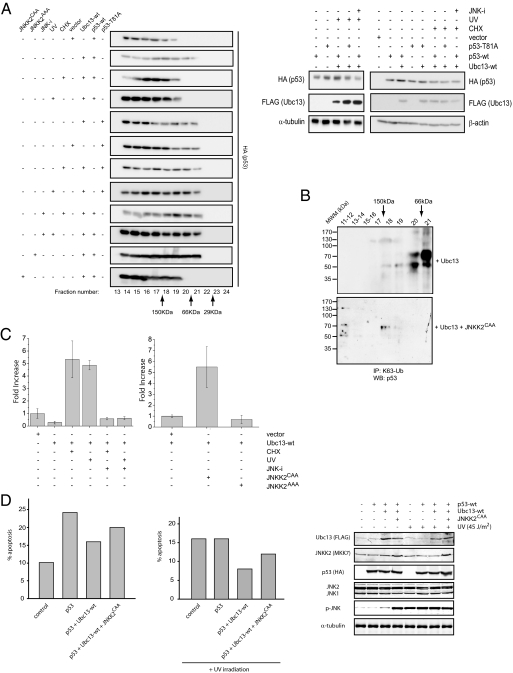
Fig. 4.
JNK-mediated disruption of Ubc13-p53 complexes controls p53 oligomerization status and its transcriptional activation. (A) U2OS cells transfected with HA-tagged wild-type p53 (p53-wt) or Thr81Ala p53 construct (p53-T81A) were cotransfected with either Ubc13 construct or with an empty vector. Where indicated, cells were treated with cycloheximide (CHX) or exposed to UV-C light (UV) with or without the pretreatment with a JNK inhibitor (JNK-i). U2OS cells were additionally cotransfected with wild-type p53, wild-type Ubc13, and JNKK2AAA or JNKK2CAA. Total cellular extracts obtained from these cells were fractionated by gel filtration, and the distribution of wild-type or mutant form of p53 protein across the fractions was monitored by Western blot analysis using anti-HA antibody. Right show the levels of p53 and Ubc13 in the extracts used for the gel filtration as determined by Western blot analysis. β-actin and α-tubulin served as loading controls. (B) U2OS cells were transfected as indicated. Forty-eight hours after transfection, cells were lysed, and whole cell extracts were fractionated by gel filtration. Resulting fractions were incubated in 6 M urea, immunoprecipitated with anti-K63-Ub antibodies, and analyzed by Western blot using a mixture of p53 antibodies. MWM denotes molecular weight markers as indicated. (C) Left: U2OS cells were cotransfected with p21-luciferase, β-galactosidase, and with either Ubc13 or an empty vector. Former cells were further treated with cycloheximide (CHX), UV-C light (UV) with or without the pretreatment with a JNK inhibitor (JNK-i). For each sample, luciferase activity was normalized to β-galactosidase activity, and the value obtained for the control, empty vector transfected cells was set to 1. Bars represent mean values ± SD (n = 3). Right: U2OS cells were cotransfected with p21-luciferase, β-galactosidase, and with either JNKK2AAA, JNKK2CAA, or an empty vector. Luciferase assays analysis and presentation of the data are as described above. (D) Saos-2 cells were transfected with the indicated plasmids. Forty-eight hours after transfection, cells were harvested. Cell cycle profiles were determined by staining DNA with PI followed by FACS analysis, and percentages of the subG1 populations, under the different experimental conditions indicated, were calculated and shown for representative experiments.

