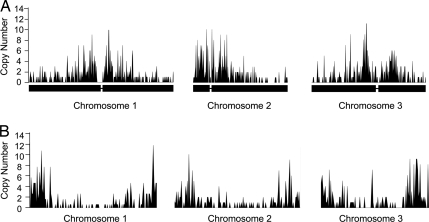
Fig. 2.
Distribution of Helitrons on 3 chromosomes of A. thaliana (A) and 3 chromosomes of C. elegans (B). x axis indicates chromosome locations while the y axis shows copy numbers of Helitrons (both intact and fragmented elements) per 100 kb. Narrow lines in A on the x axis indicate the positions of centromeres.

