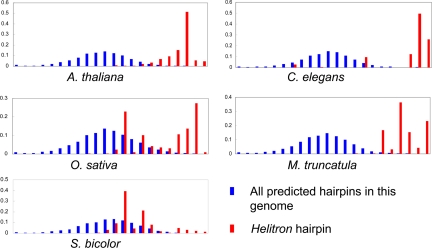
Fig. 3.
Melting temperature distributions of predicted hairpins in the 5 studied genomes. Blue denotes predicted hairpins across the entire genome, and red denotes predicted hairpins in identified Helitrons. The x axis indicates predicted melting temperature (0–100 °C) while the y axis shows the frequency of predicted hairpins with that predicted Tm.

