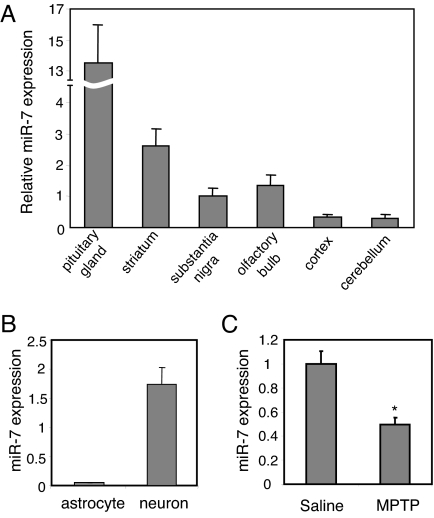
Fig. 5.
miR-7 expression in the mouse brain and in brain cell types. (A) Total RNA samples isolated from brain regions were used for qRT-PCR analysis of miR-7. Amounts are calculated relative to the level in substantia nigra. (B) Expression levels of miR-7 measured in primary neurons and astrocytes by qRT-PCR. (C) Mice were challenged with MPTP for 5 days, and 2 weeks later ventral midbrain tissue was subjected to qRT-PCR analysis of miR-7 normalized to U6 level. *, P < 0.05 for difference between saline and MPTP-treated mice.

