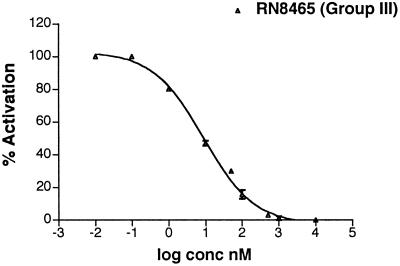
Figure 4.
The Group III strain, RN8465, was grown in the presence of differing concentrations of the truncated Group II analog. A representative inhibition curve derived from reversed-phase HPLC analysis of δ−toxin levels is shown. Quantitation of δ−toxin levels was obtained by integration of peak area from the HPLC trace.

