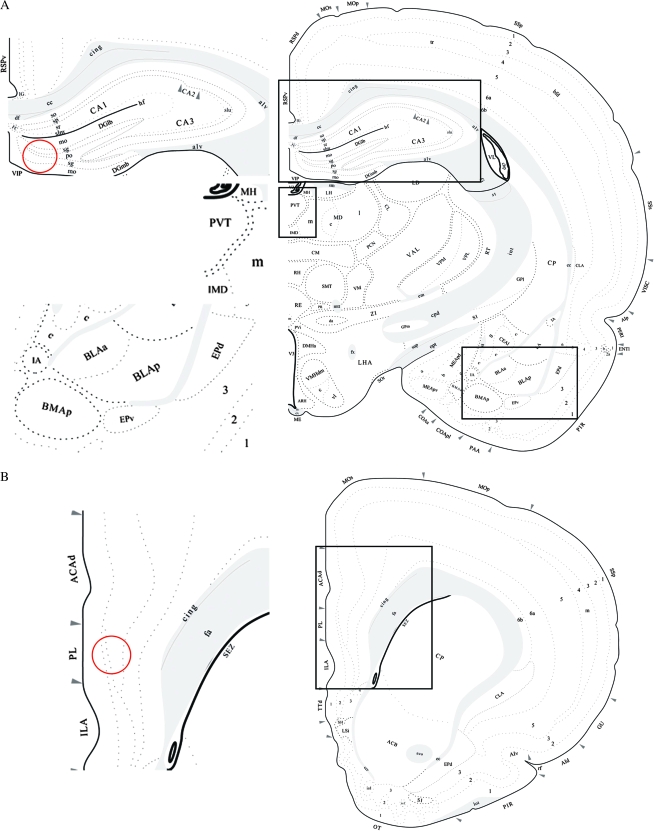
Figure 1.
Atlas (Swanson 1992) image represents the approximate brain level where proteins levels were analyzed. CREB and pCREB positive nuclei measured by immunohistochemistry were counted in (A) CA1, CA2, CA3, PVT, and amygdala (BLAa, BLAp, BMAp, and LA); (B) ACAd and ILA. BDNF levels in DG (A) and PL (B) (red circle) were measured by ELISA analysis.

