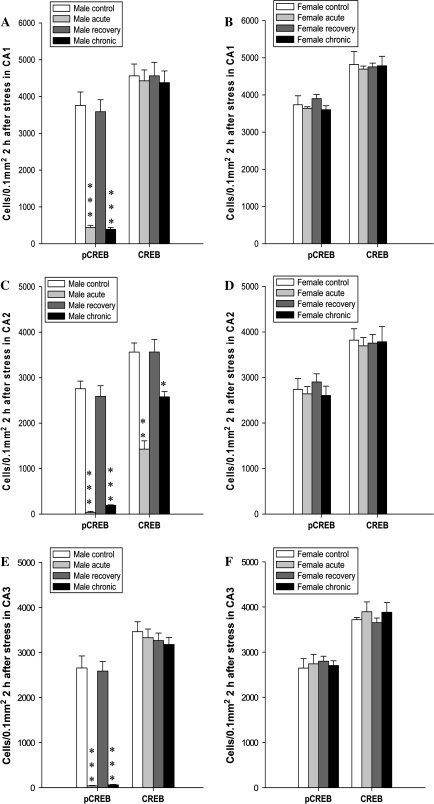
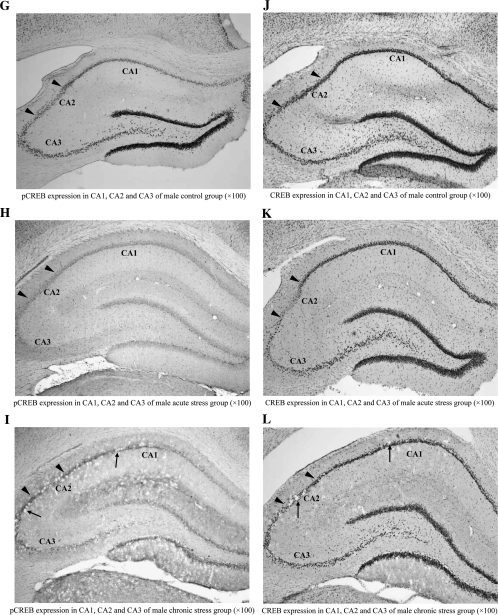
Figure 2.
Levels of pCREB and CREB in CA1, CA2, and CA3 of hippocampus. (A) Number of pCREB- and CREB-positive cells in male CA1; (B) Number of pCREB- and CREB-positive cells in female CA1; (C) Number of pCREB- and CREB-positive cells in male CA2; (D) Number of pCREB- and CREB-positive cells in female CA2; (E) Number of pCREB- and CREB-positive cells in male CA3; (F) Number of pCREB- and CREB-positive cells in female CA3; (G–I) Representative photomicrographs of pCREB-IR in CA1, CA2, and CA3 of male rat after acute and chronic stress; (J–L) Representative photomicrographs of CREB-IR in CA1, CA2, and CA3 of male rats after acute and chronic stress. Patches were clearly observed (black arrow) in CA1, CA2, and CA3 of male rats exposed to chronic stress. Data were expressed as mean ± standard error of the mean, n = 3. *P ≤ 0.05, **P ≤ 0.01, ***P ≤ 0.001 versus control group.


