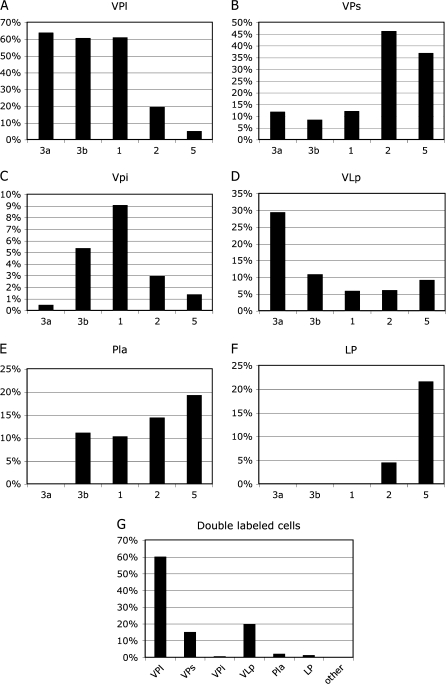
Figure 7.
The average percentage of labeled neurons found in each thalamic nucleus following injections in areas 3a, 3b, 1, 2, and 5 (A–F). Percentages of neurons were determined for each area injected and then the mean percentage for that area from all cases was used to calculate the percentages shown in these histograms. Although multiple areas often receive input from the same nucleus, the density of input can vary. For example, VP projects to all 5 somotosensory areas, but with different densities. The percentage of double-labeled cells is shown in G. Most double-labeled cells—regardless of the 2 fields injected were found in VP. Of the double-labeled cells observed, VPs and VLp had smaller percentages. The scales (y axis) for each histogram shown here vary.

