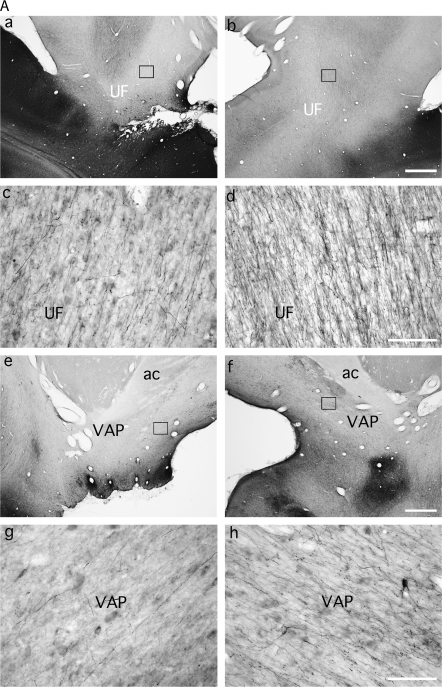
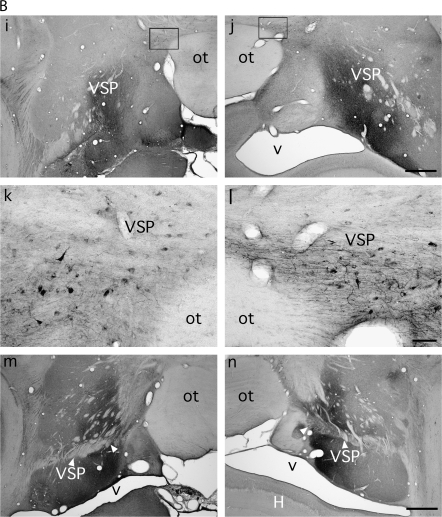
Figure 6.
(a, b) Photomicrographs from case M2 showing the disruption of the labeled fibers in the UF (UF, a–d), the VAP (e–h), and the VSP (i–n), after left MTL removal relative to the normal contralateral hemisphere. Scale bars a, b, e, f, i, j, m, n: 1 mm; c, d, g, h, k, l: 100 μm. ot, optic tract; ac, anterior commissure; H, Hippocampus.


