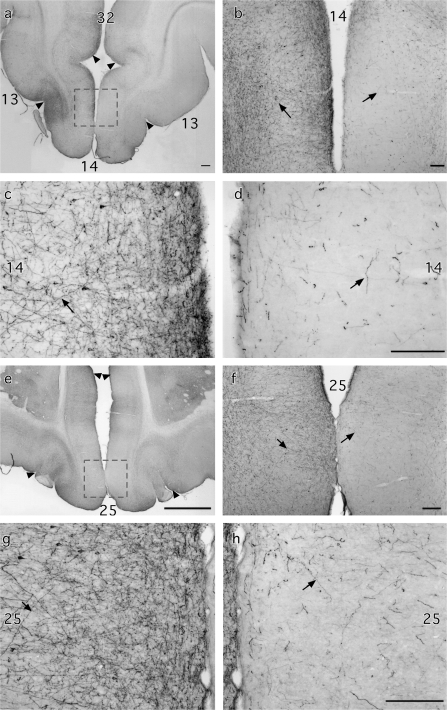
Figure 7.
Photomicrographs of the ventral medial frontal cortex comparing the label after rSTG injections in the normal and MTL-lesioned hemispheres of Case M2. Area inside dashed-outline rectangles in (a) and (e) shown at higher magnification in (b–d) and (f–h), respectively. Arrows identify labeled axons in photomicrographs at low and high power magnifications. Scale bar: 250 μm.

