
Figure 2. Distribution of H3K4me3 and H3K27me3 islands.
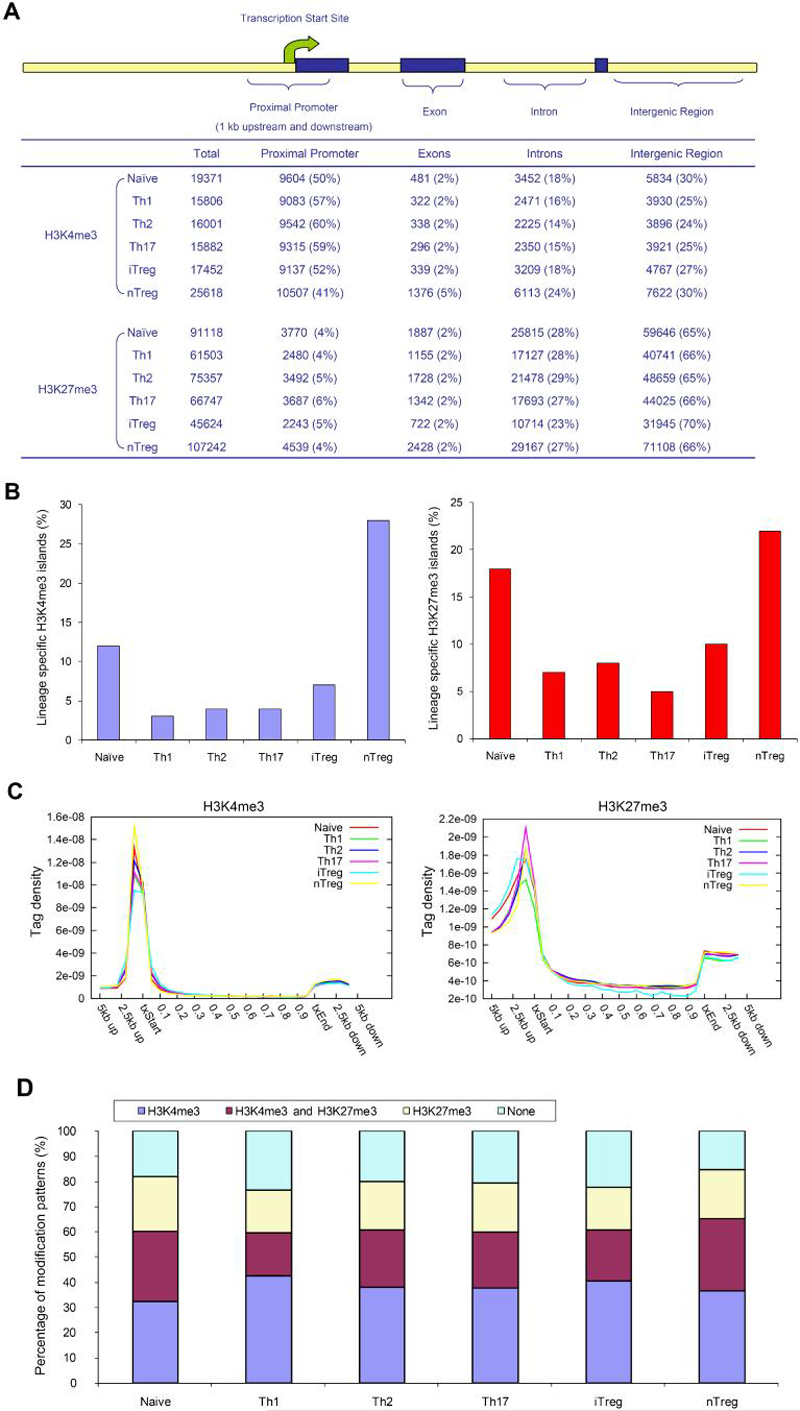
(A) The mouse genome was divided into four kinds of regions: proximal promoter (1 kb upstream and downstream of transcription start site), exon, intron, and intergenic regions. The number of islands for each sample was listed as the total identified islands (Total), followed by the islands among genomic regions with the percentage listed in the parenthesis.
(B) Lineage-specific islands were identified as described in Supplemental Information. The percentage of lineage-specific H3K4me3 (left) and H3K27m3 (right) islands is expressed as a proportion of all islands identified in each lineage.
(C) For each gene, uniquely mapped tags were summed in 1 kb windows for the regions from 5 kb upstream of the transcription start site (txStart) to the txStart and from the transcription end site (txEnd) to 5 kb downstream. Within the gene bodies, tags were summed in windows equal to 5% of the gene length. All tag-counts were normalized by the total number of bases in the windows and the total read number of the given library to obtain normalized tag density (Wang et al., 2008).
(D) The percentage of genes associated with H3K4me3 alone, both H3K4me3 and H3K27me3, H3K27me3 alone, or not associated with H3K4me3 or H3K27me3 for each T cell subsets.