
Figure 4. Lineage specific alternative transcript usage and functional regulatory elements.
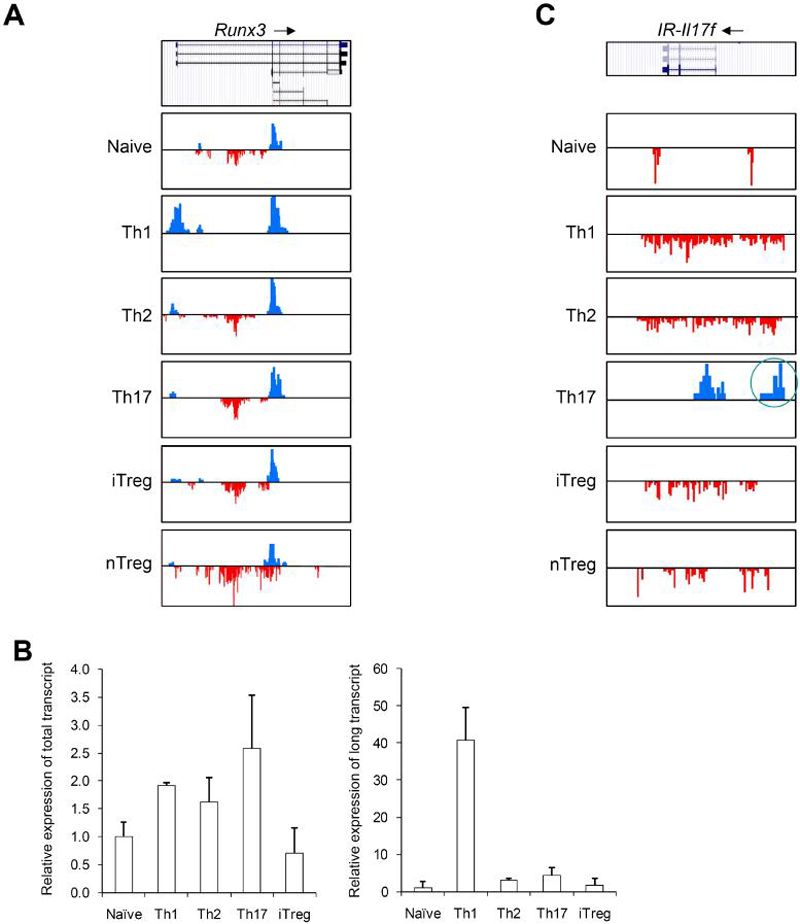
(A) Distribution of H3K4me3 and H3K27me3 islands along the Runx3 genomic region (Chr4, 134389000-134451000) in six T cell subsets is shown. All figures with views of H3K4me3 and H3K27me3 distribution are labeled such that the arrow represents the direction of gene transcription. Gene structure is downloaded from UCSC Genome Browser and only tags on islands are shown. The islands labeled in blue represent H3K4me3. The islands labeled in red represent H3K27me3. Scales are kept constant among cell types.
(B) Real-time PCR was performed on RNAs from naïve, Th1, Th2, Th17, and iTreg cells using primer sets that recognize both the long and short forms (left panel) or only the long form (right panel) of Runx3 transcripts.
(C) Distribution of H3K4me3 and H3K27me islands along the Intergenic Region upstream of Il17f (IR-Il17f) (Chr1, 20,755,000-20,780,000) in six T cell subsets is shown. The intergenic H3K4me3 island is highlighted by a red circle.