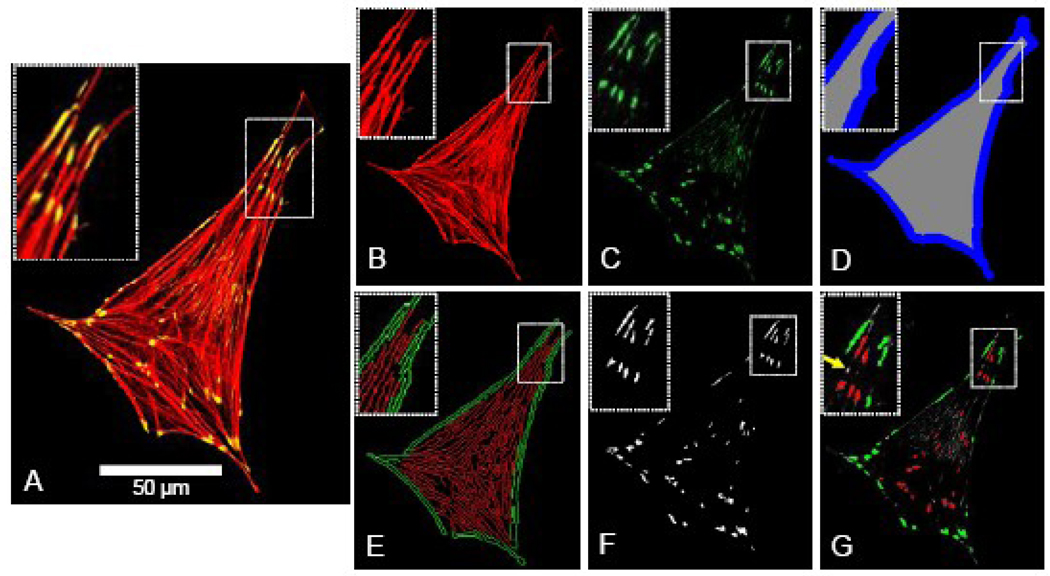
Figure 1.
Images and approach used for image quantification of actin stress fiber density, edge actin bundle density, density and area of focal adhesions, cellular area and circularity, as described in further detail under Image Quantification in the Methods. For each cell under examination, the input into the program included three separate images extracted from the original confocal micrograph, including an image of the F-actin + vinculin overlap (Figure 1A), F-actin alone (Figure 1B), and vinculin alone (Figure 1C). The F-actin image was converted to binary, and the cellular area, perimeter, and circularity were calculated. The internal (Figure 1D - gray region) and perimeter (blue region) regions of the cell were defined, corresponding with the locations of the actin stress fibers and actin edge bundle, respectively. The F-actin image (Figure 1B) was normalized for average pixel intensity, intensity-thresholded to minimize background fluorescence, converted to binary, and extraneous objects with an area of ≤0.5 µm2 were removed. The resulting image was subjected to a Canny filter edge-detecting algorithm, producing an image (Figure 1E) depicting the edges of F-actin fibers in the perimeter (green – edge actin bundle) and internal regions of the cell (red – stress fibers). This image was thresholded by aspect ratio of each detected edge to remove circular non-filamentous artifacts. The area occupied by F-actin edge was computed separately in both the perimeter and internal regions of the cell, and stress fiber density and edge actin bundle density were calculated by normalizing the area occupied by F-actin edge in the internal and perimeter regions of the cell (Figure 1E) by the area of the internal and perimeter regions, respectively. To quantify the focal adhesion density and average size, the vinculin image (Figure 1C) was intensity-thresholded to reduce background fluorescence, converted to binary, and extraneous objects ≤0.3 µm2 [13] were removed (Figure 1F). Focal adhesion density (focal adhesions per cellular area) and average focal adhesion size were calculated for the cell as a whole. Figure 1G depicts the focal adhesions that were detected based on these criteria (red = internal focal adhesion; green = perimeter focal adhesion; yellow arrow = vinculin aggregate below area threshold of 0.3 µm2).

