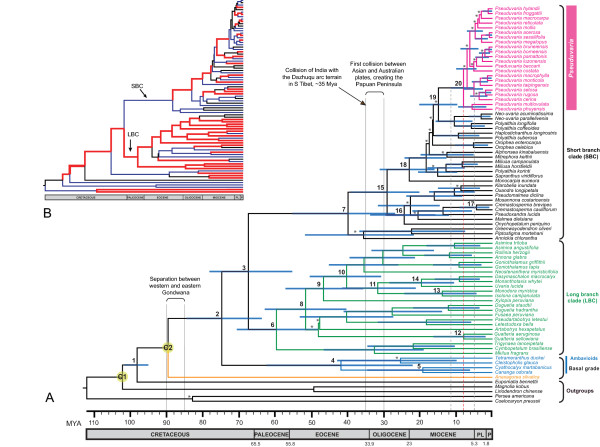
Figure 2.
Chronograms of Annonaceae: maximum clade credibility trees from the BEAST analysis of matrix A. (A). Posterior estimates of divergence times were inferred using partitioned analyses based on five chloroplast regions, a UCLD model, and two fossils as minimum age constraints: an Archaeanthus fossil date of 98 Mya (calibration C1), and a Futabanthus fossil date of 89 Mya (calibration C2). Nodes are posterior mean ages (Mya), with blue node bars representing the 95% HPD intervals (see Table 2 for details). Bayesian PP < 0.95 are indicated by asterisks above branches. Geological time-scale abbreviations: PL, Pliocene; P, Pleistocene. The red dashed line represents the estimated tMRCA of Pseuduvaria crown, with a 95% HPD indicated by the grey vertical lines. (B). Rate of evolution across all branches. Broad red lines indicate lineages where the posterior rate is greater than the mean rate; narrow blue lines indicate lineages where the posterior rate is lower than the mean rate.

