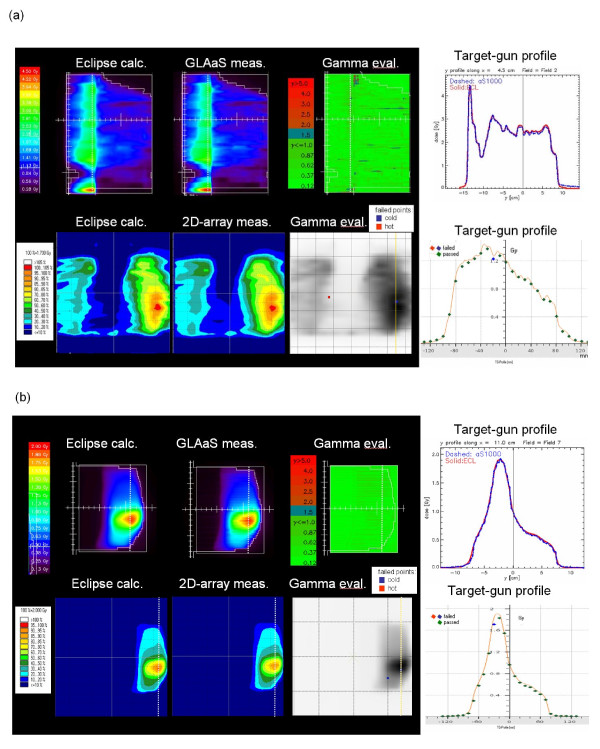
Figure 5.
Example of pre-treatment dosimetric measurements with the GLAaS method and with the PTW-729: a) IMRT, b) RapidArc. In each figure it is shown: i) 2D dose maps calculated by Eclipse and measured at Linac. Planes shown are at 15 mm depth in water (GLAaS) or at isocentre PTW-729); ii) the 2D γ map for GLAaS or the overlay between the calculated 2D dose map and the detector points violating the threshold γ <1; iii) dose profiles along the dashed line shown in the 2D maps, comparing measure and calculation. In the case PTW-729 calculation is the solid line while measurements are the points.

