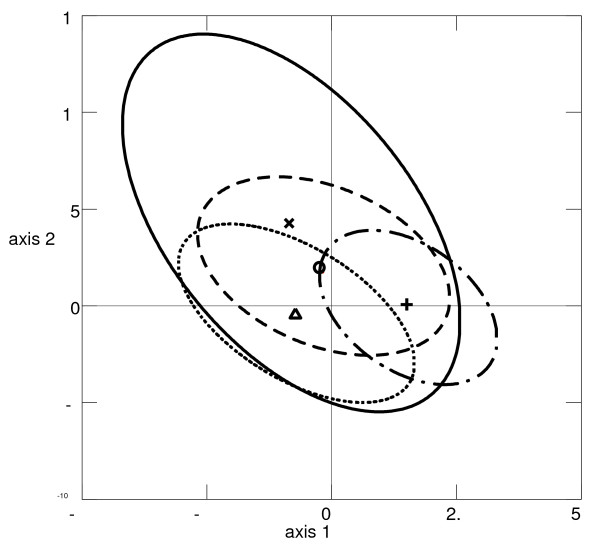
Figure 2.
Results of canonical correspondence analysis (CCA). Relative contribution of the variables "sites" and "genotypes" to the genetic structure of P. falciparum populations in four sites. P. falciparum populations were projected on the first two axes of the CCA. Centroids (dots) of each parasite populations are surrounded by the 95% C.I.s (ellipses). (x and solid oval stand for Congo population (n = 15), o and dash oval stand for the Cameroon population (n = 35), + and long dash dot oval stand for the French Guyana population (n = 137) and Δ and round dot oval stand for the Thailand population (n = 286).

