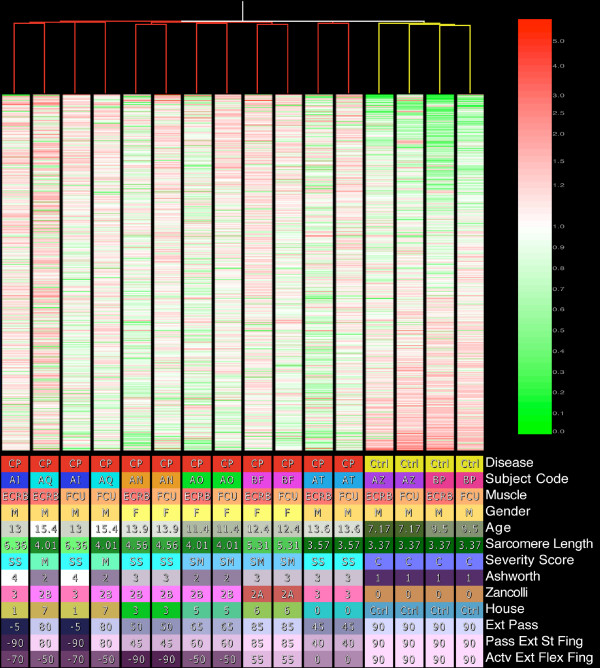
Figure 1.
Top: Condition tree created using Pearson Correlation for the similarity score and an average linkage clustering algorithm. The tree was created based on all present features. MAS5 data were used with expression values normalized to each features median. Features are ordered from highest expression ratio to lowest. Bottom: Clinical conditions color-coded with values for each sample.

