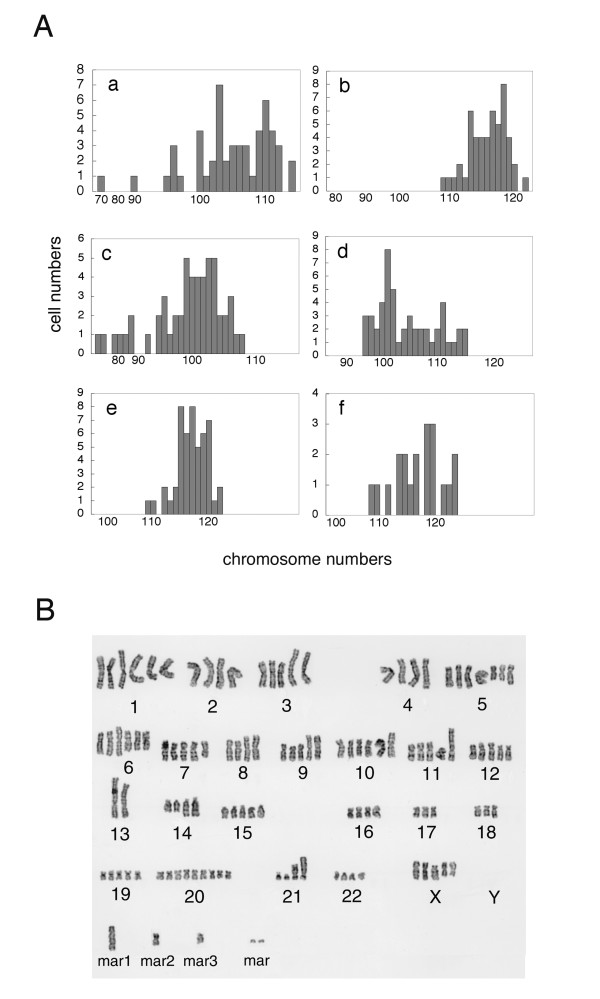
Figure 3.
Cytogenetic analysis of pleomorphic adenoma cell systems. Panel A, chromosome numbers of pleomorphic adenoma cell systems: SM-AP1 (a), SM-AP2 (b), SM-AP3 (c), SM-AP4 (d), SM-AP5 (e), and those of cells in the primary culture (f) in histograms. Panel B, G-banded karyotyping of SM-AP5. Chromosome numbers of the five cell systems varied between 64 and 123, which were within tetraploid or pentaploid ranges, with a modal chromosome number of 108. Those of primary culture varied between 107 and 122 with a modal of 113.

