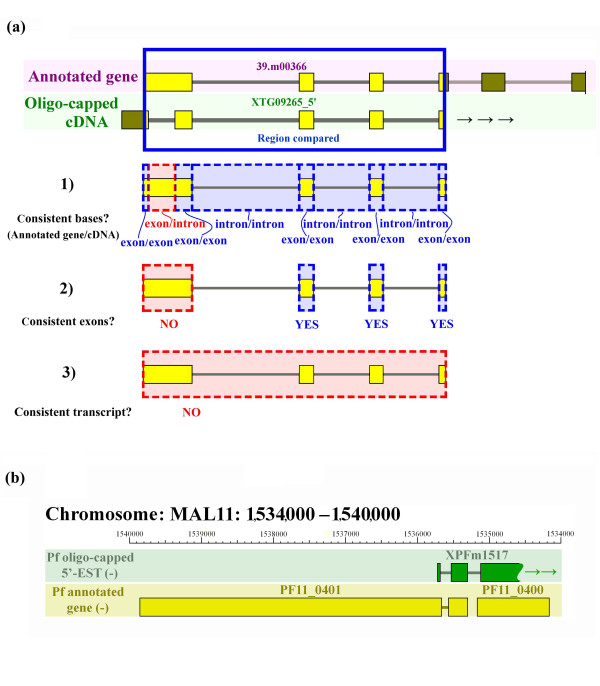
Figure 1.
Example of the evaluation of and merging of a 5'-end cDNA sequence with its annotated gene model. (a) Genomic regions that were covered by both an annotated gene model and a cDNA were used for evaluation purposes (yellow boxes indicate exons, gray lines indicate introns). Inconsistency is illustrated here at the base level (1) and at the exon level (2). Blue dashed boxes and red dashed boxes represent consistent and inconsistent parts, respectively. Results of the evaluation are shown on the left. Because of the inconsistencies shown in (1) and (2), this annotated gene model was categorized as inconsistent at the transcript level in (3). (b) Example of a cDNA that corresponds to two annotated genes. The 5'-EST of the oligo-capped cDNA (XPFm1517; first line) and annotated gene models (PF11_0401 and PF11_0100; second line) are shown. XPFm1517 represents the three exons at the 5'-end, with an undetermined 3'-end.

