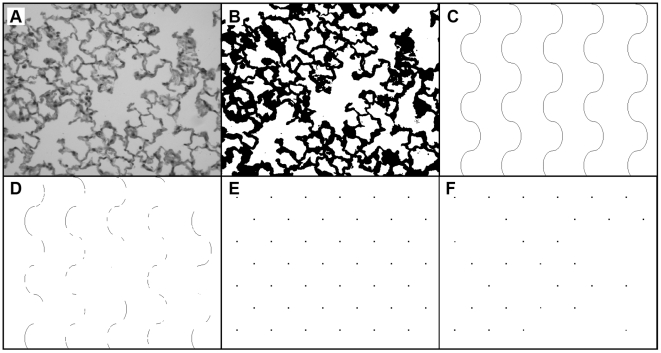
Figure 2. Image analysis steps for calculating Lm.
A) H&E stained image acquired at 200×magnification. B) Threshold of image distinguishes tissue from airspace. C) Cycloid grid lines. D) Intersection of cycloid lines with tissue in thresholded image (B). E) Grid points. F) Intersection of grid points with airspace in thresholded image.

