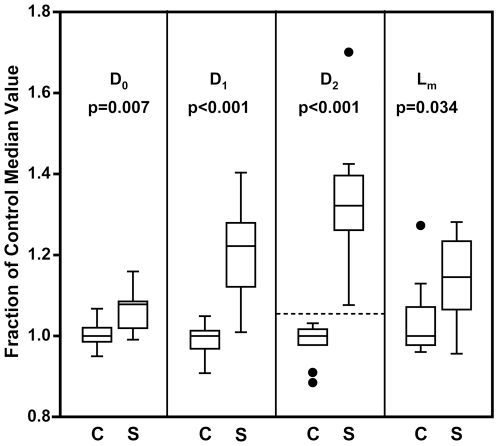
Figure 6. Boxplots of histological data from the 10 control (C) and 10 smoke-exposed (S) mice.
D0 is the mean equivalent diameter, D1 and D2 are weighted indexes of airspace size distribution, and Lm is the mean linear intercept. Data were normalized to the median values of the control group. The p-values indicate the significance of the ability of each method to discern between the treatment groups. The dotted line was added to illustrate the lack of overlap between groups in the D2 results. In these boxplots, the box vertical dimensions represent the first and third quartiles, the line inside the box represents the median (second quartile), the bars represent the largest and smallest non-outliers (within 1.5 times the interquartile range), and the points represent outliers (beyond 1.5 times the interquartile range).

