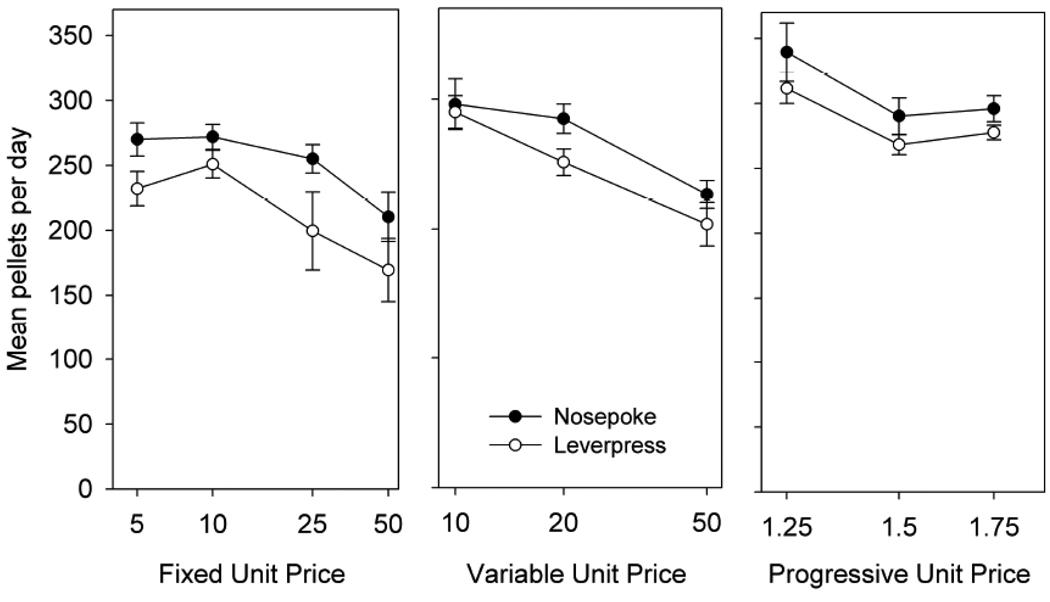
Figure 1.
Mean (±SEM) number of pellets taken per day as a function of unit price under fixed (left panel), variable (middle panel), and progressive (right panel) ratio schedules. Data are for separate groups (Ns=8) required to emit either nose poke or lever press responses to obtain food, but for the same animals is left-to-right progression across costs and schedules. Note that the fixed price axis is scaled logarithmically.

