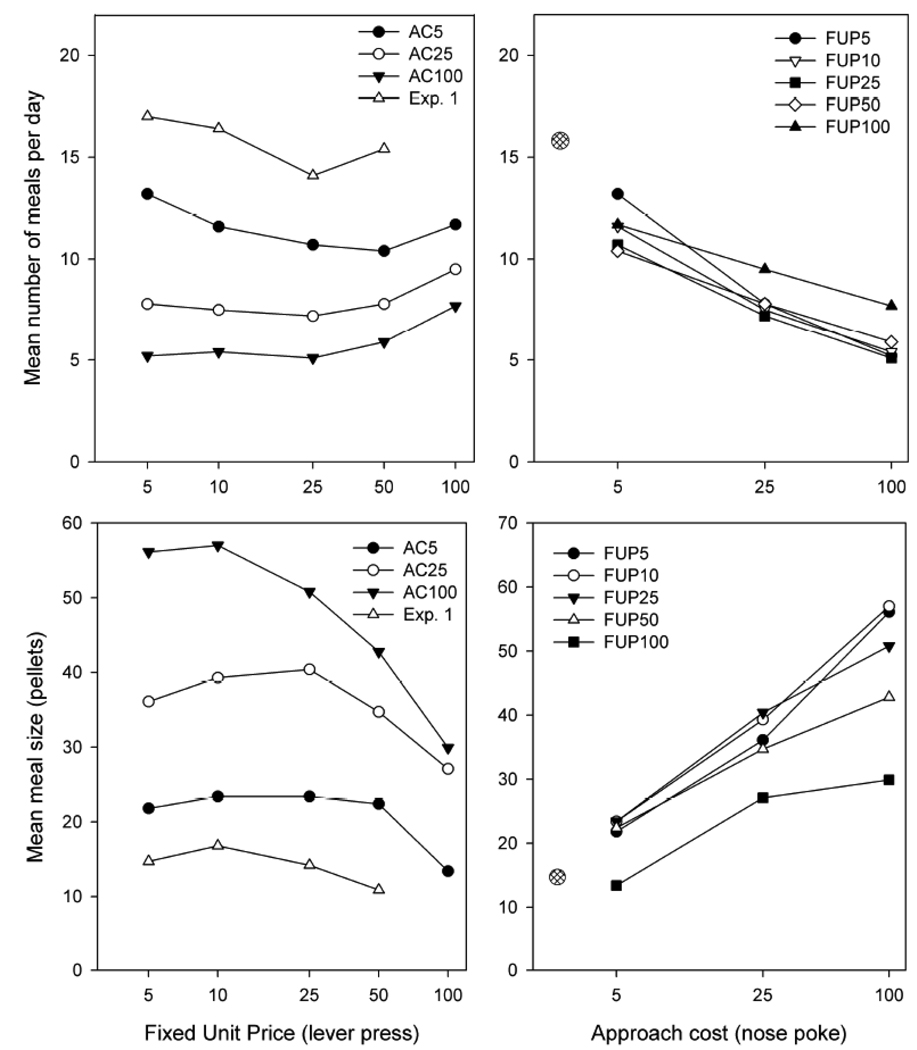
Figure 7.
Left panels: Mean meal numbers (top panels) and meal sizes (bottom panels) from Experiment 1 (data from Fig 2, approach cost AC=0) and Experiment 2 (data from Fig 5, AC=5, 25, or 100) as a function of the fixed unit price in lever presses. Right panels: mean meal numbers and sizes in Exp. 2 (data from Fig 5) and Experiment 1 (large round circle, shown at a small but non-zero cost) as a function of approach cost in nose pokes.

