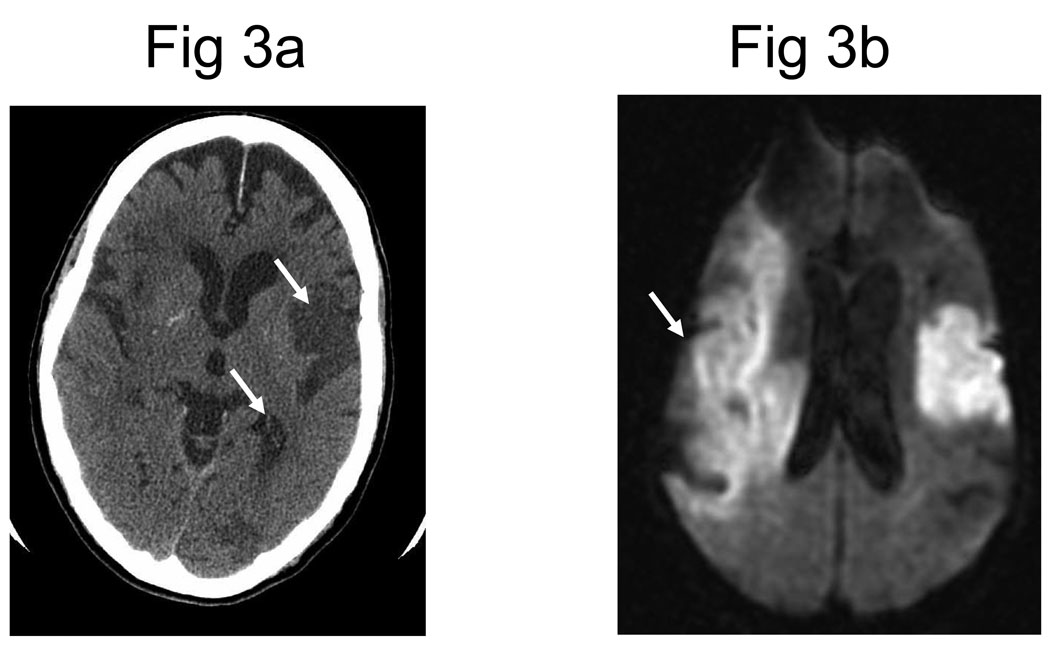
Figure 3.
(A) Noncontrast computed tomography (CT) showing two hypodense regions indicating old infarctions in the distribution of the left-middle cerebral (arrow) and posterior cerebral arteries (arrow). (B) Diffusion-weighted magnetic resonance imaging obtained shortly after the CT reveals a new extensive infarction (arrow) in the right-middle cerebral artery distribution not evident on the CT.
Reprinted with permission from Image source Wilford Hall Medical Center, as archived in MedPix.

