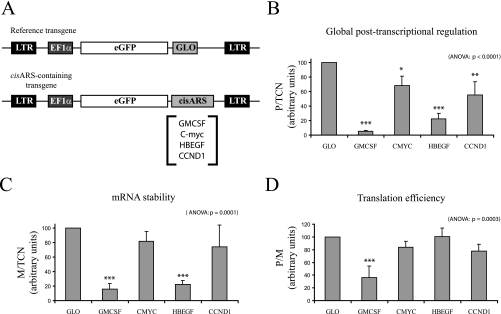
Fig. 3.
Measurement of 3′-UTR-mediated post-transcriptional regulations by FunREG. A, schematic representations of the different transgenes used in this study. The referent eGFP-GLO transgene is shown in the top panel. The transgenes containing selected cisARSs are shown in the bottom panel. LTR, long terminal repeat. B–D, HuH7 cells were transduced once with lentiviral particles expressing the indicated transgene. After 1 week, the transgene copy number and eGFP mRNA amount were determined by qPCR and qRT-PCR using genomic DNA or reverse transcribed total RNA extracted from each transduced cell population, respectively. The eGFP protein amount was determined by flow cytometry on each transduced cell population. B, global post-transcriptional regulation. C, mRNA stability. D, translation efficiency. In this and the following figures, the different ratios (in arbitrary units) are shown on the y axes, error bars represent S.D., and analysis of variance (ANOVA) p values are indicated at the top right of the figure (n = 3). Significant variations using Dunnett post-test are represented by asterisks above the corresponding bar when comparing the referent (or control) condition and the indicated condition or above the line when comparing the two indicated conditions: *, p < 0.05; **, p < 0.01; and ***, p < 0.001.

