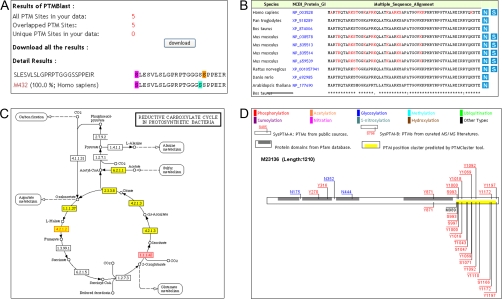
Fig. 2.
Sample pages showing the interface for SysPTM tools. A, PTMBlast results. Unique (aqua for SysPTM data and orange for query data) and overlapped PTM sites (magenta) are highlighted in color on the protein sequence for display and download. B, PTMPhylog results. PTM sites are mapped to aligned sequences of ortholog proteins in different species. Red residues are from SysPTM-A; blue residues are uniquely from SysPTM-B. C, PTMPathway results. Rectangles with yellow background area denote PTM proteins found in SysPTM; pink texts in rectangles denote user-defined proteins. D, PTMCluster results. The protein is plotted as a horizontal box. In this box, predicted PTM clusters are represented as yellow bars, and Pfam domains are shown as gray bars. PTM sites from SysPTM-A and SysPTM-B, respectively, are labeled above and below the protein box.

