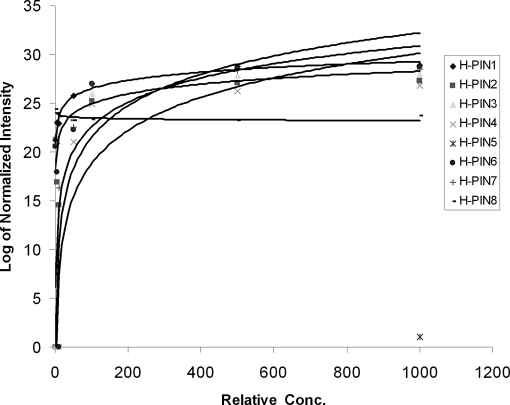
Fig. 2.
The log of normalized intensity versus relative concentration (simulating analytical variation) is shown. The normalization algorithm is capable of correcting up to about 10-fold variation. Variation beyond this value cannot be corrected by population normalization and would lead to serious errors and an increase in false positive assignments.

