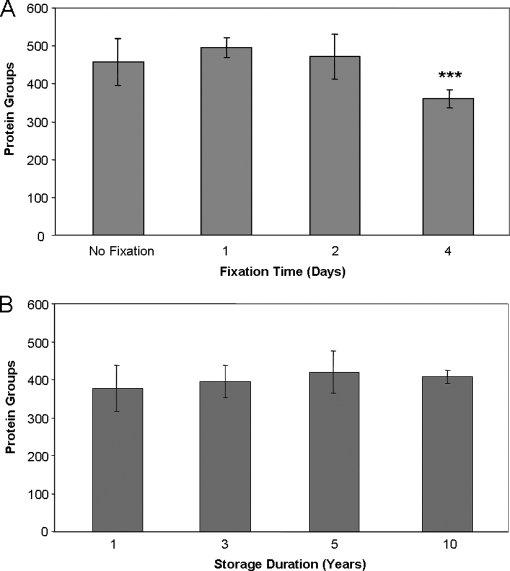
Fig. 4.
Assessment of FFPE sample processing and storage variability on protein identifications by shotgun LC-MS/MS. A, effect of fixation time on efficiency of shotgun proteomic analysis. Error bars represent standard deviation (n = 9). B, effect of storage duration on efficiency of shotgun proteomic analysis on FFPE samples. Error bars represent standard deviation (n = 9). *** indicates significantly different from all other groups (ANOVA, p < 0.0001, Bonferroni post-test versus frozen, 1 day and 2 day fixation: ***, p < 0.001).

