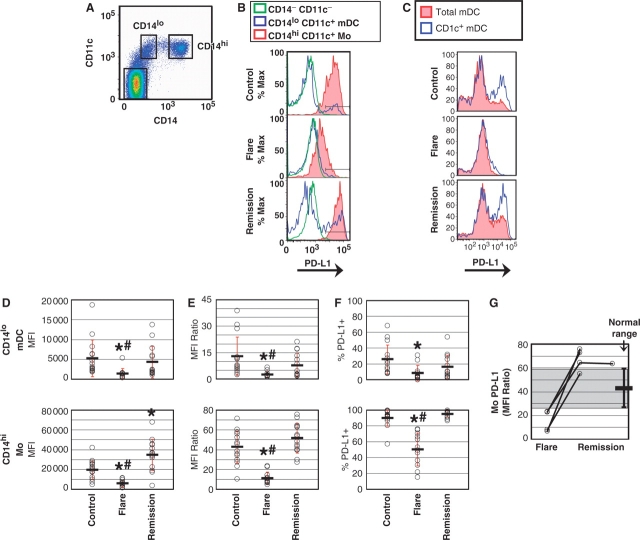
Fig. 2.
PD-L1 protein is deficient on APC during SLE flare, but not during remission. (A) PBMC were cultured for 1 day and APC subsets identified. (B) PD-L1 expression on both mDC and Mo was reduced during SLE flare, but not during remission. (C) CD1c staining demonstrated that PD-L1 expression in CD14lo CD11c+ cells was enriched on Type I immature mDC. (D) PD-L1 levels on mDC (upper graph) and Mo (lower graph) from 15 controls, 12 SLE flare and 14 SLE remission. Circles represent individual PD-L1 values and bars represent the mean MFI (±1 s.d.) for each group. For SLE flare mDC, *P < 6.5 × 10⁻³ compared with controls; #P < 2.5 × 10⁻² compared with remission. For SLE flare Mo, *P < 1.8 × 10⁻⁴ compared with controls; #P < 2.4 × 10⁻⁶ compared with remission. For SLE remission Mo, *P < 3.4 ×10⁻³ compared with controls. (E) PD-L1 expression on mDC and Mo was normalized to background levels using the PD-L1 MFI of CD14− CD11c− cells as the denominator for each sample. For SLE flare mDC, *P < 4.1 × 10⁻³ compared with controls; #P < 2.1 × 10⁻² compared with remission. For SLE flare Mo, *P < 2.0 × 10⁻⁶ compared with controls; #P < 1.1 × 10⁻⁸ compared with remission. (F) SLE flare patients exhibited a lower percentage of PD-L1+ APC (mDC, upper graph and Mo, lower graph). For SLE flare mDC, *P < 4.2 × 10⁻³ compared with controls. For SLE flare Mo, *P < 1.1 ×10⁻⁶ compared with controls; #P < 4.0 ×10⁻⁸ compared with remission. (G) Mo PD-L1 values from (E) were graphed for patients with serial blood samples; shaded area denotes the ‘normal range’ of Mo PD-L1 expression observed in healthy controls (mean ± 1 s.d.).

