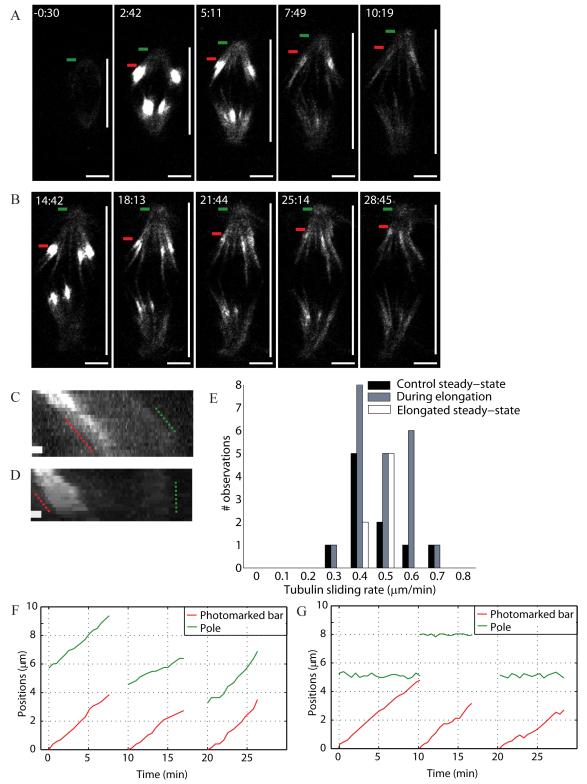
Figure 4.
Spindle compression reduces microtubule depolymerization at poles while leaving the tubulin sliding rate unchanged. Tubulin sliding (A) during and (B) after elongation in Ptk1 PA-GFP-α-tubulin spindles being compressed. Green bars mark the poles and red bars the leading edge of photomarked tubulin. Vertical white bar marks spindle length. Tubulin photomarking was performed at 2:25 (min:s) and 14:25. Compression started at 0:00 and scale bar corresponds to 5 μm. Kymographs show the motion of photomarked tubulin with respect to the poles (C) during (over 10 min) and (D) after (over 7.5 min) elongation; scale bar corresponds to 1 μm. (E) Histogram of tubulin sliding rates before (control), during and after spindle elongation. Respective positions of the photomark and pole in three example traces (F) during and (G) after elongation (time translation for clarity).

