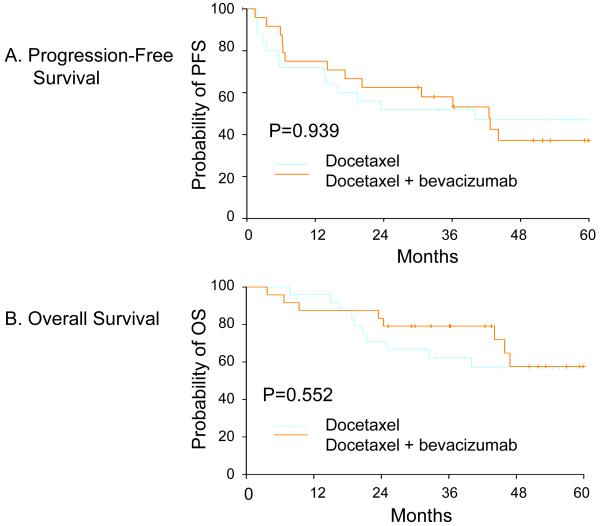
Figure 1. Kaplan-Meier Outcome Curves.
Panel A shows the Kaplan-Meier estimation of progression-free survival (PFS) in months demonstrated by the two treatment groups: docetaxel (D) vs. docetaxel + bevacizumab (DB). The probability of PFS with DB treatment was consistently larger up to 3 years than with D treatment, though the difference was not statistically significant. Panel B shows the Kaplan-Meier estimation of overall survival (OS) in months demonstrated by the two treatment groups: docetaxel (D) vs. docetaxel + bevacizumab (DB). The median OS has not been reached in either treatment group, but again, there was no statistically significant difference in OS.

