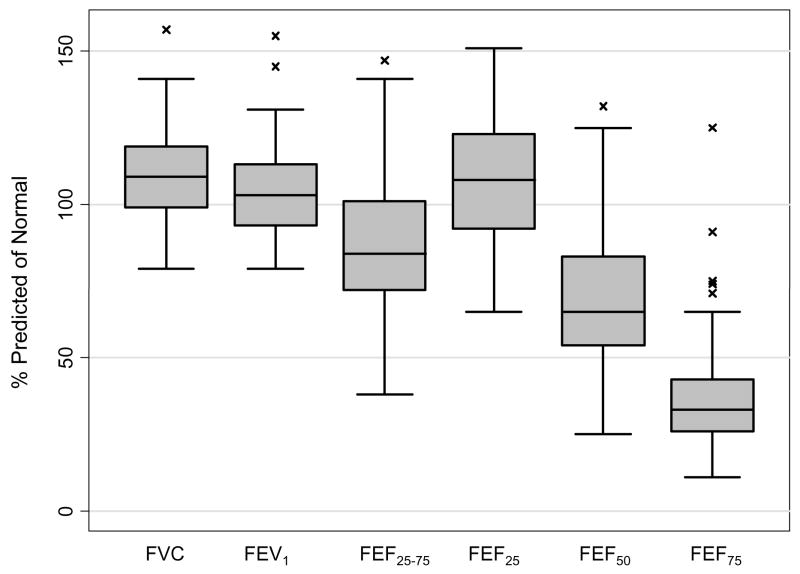
Figure 1.
Box plot distribution of spirometry of the flight attendants as percent predicted values for their sex, age, and height (N=61). The box represents the interquartile range; the horizontal line inside the box represents the median; and the vertical lines (whiskers) represent the minimum and maximum non-outlier values. Outlier values are shown by a cross (x).

