
Fig. 3.
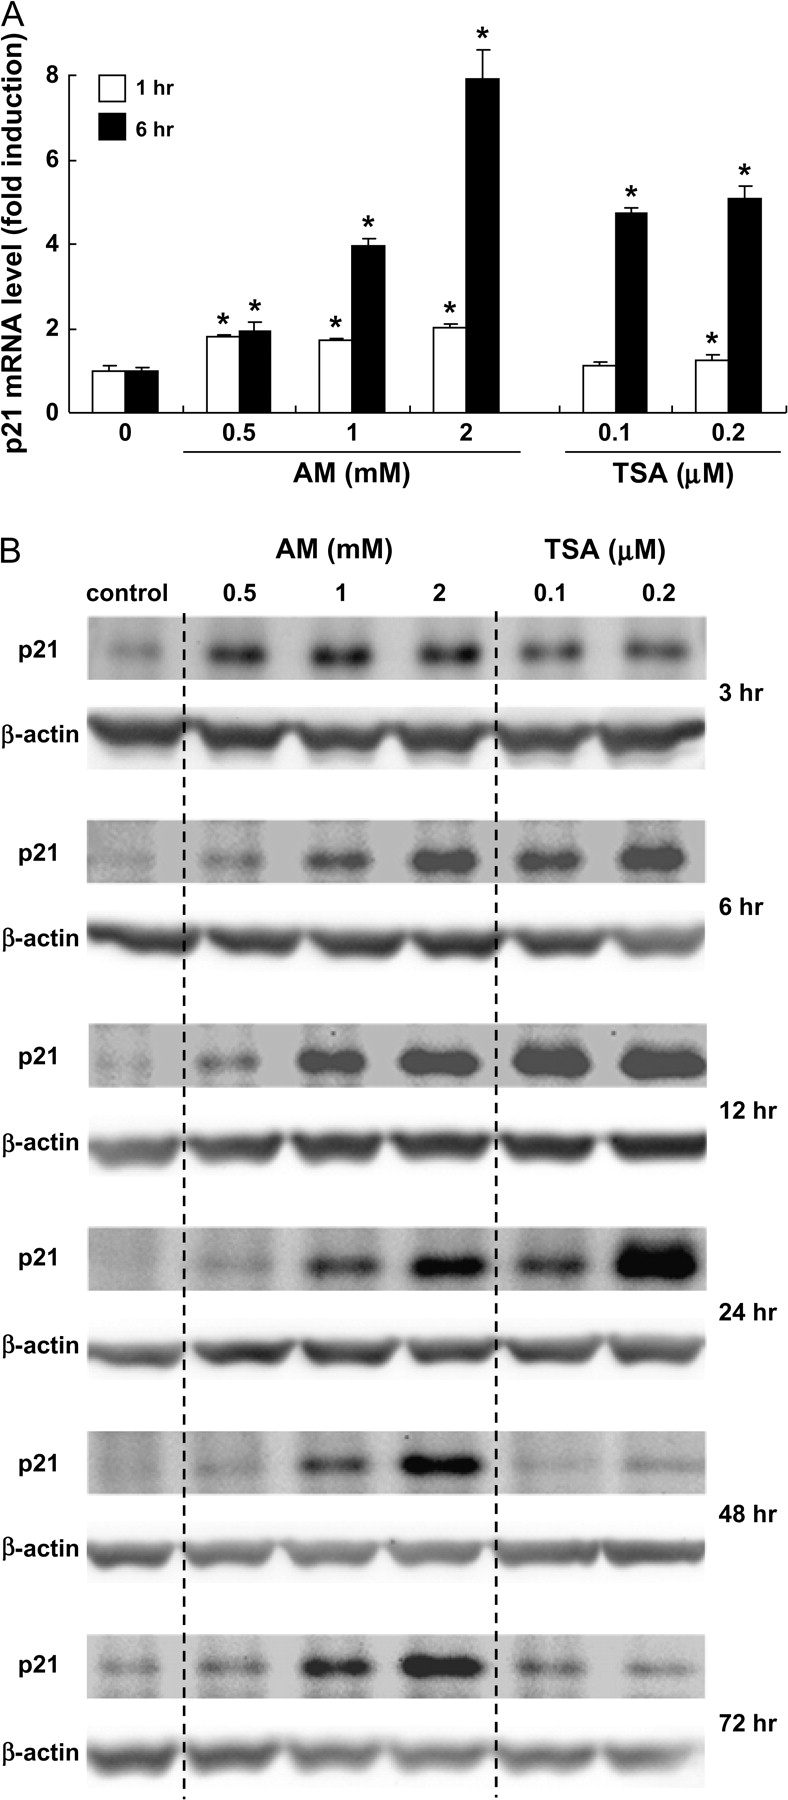
AM and TSA induce p21 expression in HT29 cells. (A) Real-time reverse transcription–PCR was used to quantify p21 mRNA expression after 1 and 6 h of treatment with AM (0.5, 1 and 2 mM) or TSA (0.1 and 0.2 μM). glyceraldehyde 3-phosphate dehydrogenase was used as internal control. Results are shown as fold induction, relative to the corresponding vehicle controls; mean ± SD, n = 3, *P < 0.05. (B) Immunodetection of p21 protein expression with β-actin as loading control.