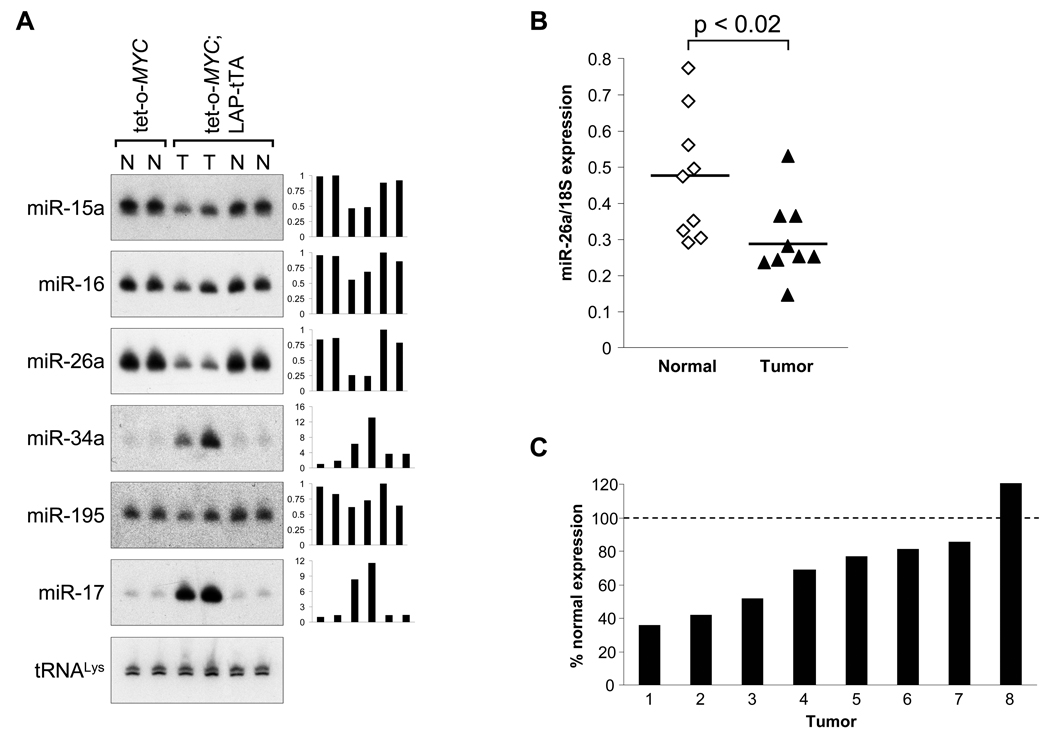
Figure 1. Dysregulated expression of miRNAs in mouse and human liver tumors.
(A) Northern blot analysis of miRNA expression in normal liver (N) or tumor tissue (T) from mice of the indicated genotypes. Graphs depict relative quantification of miRNA levels normalized to tRNALys abundance.
(B) qPCR analysis of miR-26a expression in human HCC and normal liver biopsies. miRNA abundance was normalized to 18S rRNA expression. p value calculated by two-tailed t test.
(C) miR-26a expression in individual HCC tumors relative to expression in paired normal liver samples.

