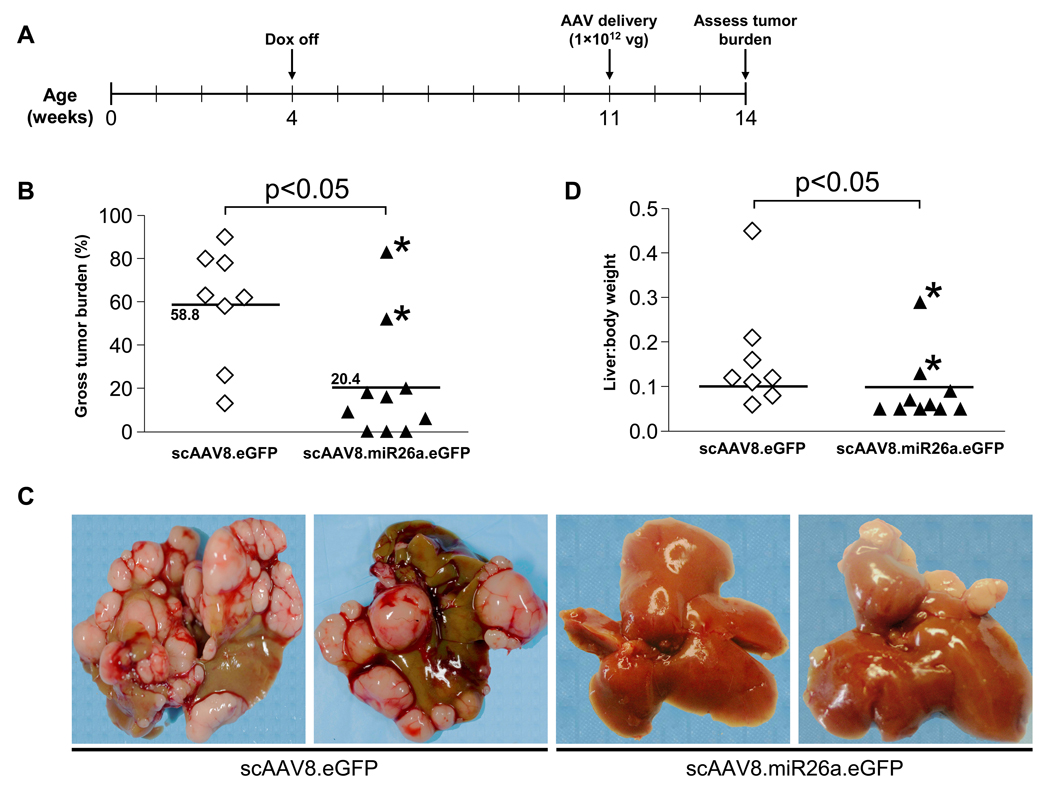
Figure 5. AAV-mediated miR-26a delivery suppresses tumorigenesis in tet-o-MYC; LAP-tTA mice.
(A) Time-line of miR-26a therapeutic delivery experiment.
(B) Gross tumor burden of livers from miR-26a-treated and control animals, as determined by quantification of tumor area using the ImageJ software package. The mean tumor burden in each treatment group is indicated by horizontal lines. Data points highlighted by asterisks represent animals that exhibited low AAV transduction efficiency (see Fig. S5). p value calculated by two-tailed t-test.
(C) Representative images of livers from miR-26a-treated and control animals.
(D) Liver:body weight ratios of miR-26a-treated and control animals. A chi-square statistic was used to compare the fraction of animals in each treatment group with a liver:body weight ratio above 0.1 (indicated by horizontal line). Data points highlighted by asterisks represent animals that exhibited low AAV transduction efficiency (see Fig. S5).

