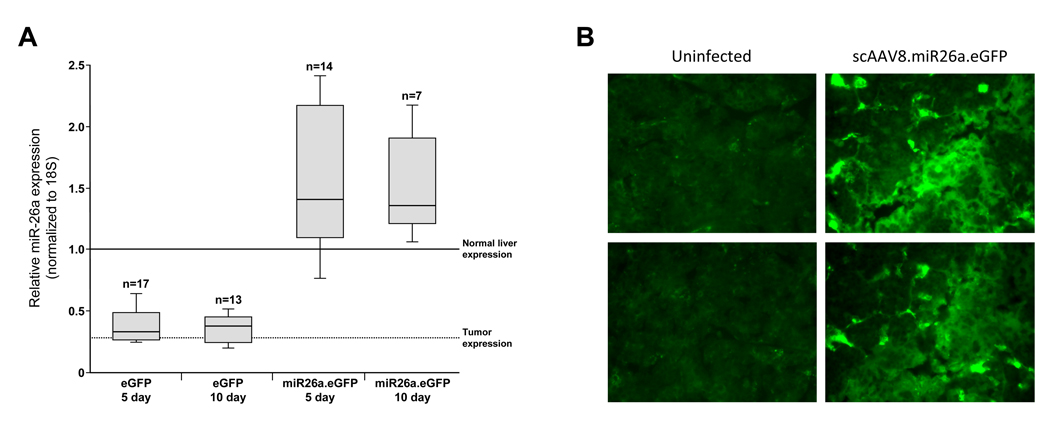
Figure 6. AAV-mediated transduction of tumor cells in tet-o-MYC; LAP-tTA mice.
(A) Expression of miR-26a in tumors in AAV-transduced animals. qPCR was used to measure miRNA abundance in tumors 5 or 10 days following administration of scAAV8.eGFP (eGFP) or scAAV8.miR26a.eGFP (miR26a.eGFP). All values were normalized to 18S rRNA expression. Normal liver expression and tumor expression lines were derived from qPCR analysis of miR-26a levels in samples shown in Figure 1A. Each box represents the range of expression observed. The ends of the boxes represent the 25th and 75th percentiles, the bars indicate the 10th and 90th percentiles, and the median is depicted by a horizontal line within the boxes.
(B) Fluorescence microscopy of tumor sections demonstrating GFP expression in tumor cells in AAV-transduced animals.

