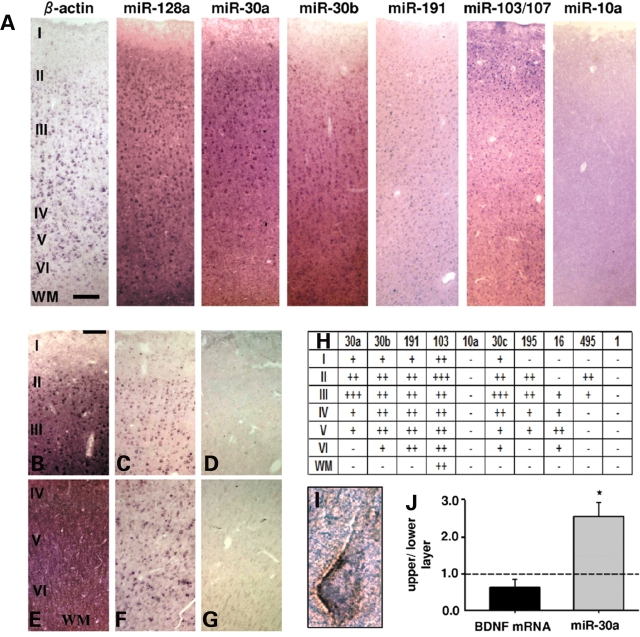
Figure 2.
Lamina and cellular expression pattern of selected miRNAs in human PFC. (A) Representative images (from 2–6 replicates) of six-layered PFC (adult) sections processed by LNA-ISH with miRNA-specific probes, and β-actin as control. Notice lamina-specific expression patterns, including enrichment of miR-30a in layers II and III. (B–G) Additional images of upper (B–D) and deeper (E–G) cortical layers for miR-30a LNA-ISH (B and E) together with β-actin (C and F) and no probe negative control (D and G). (H) Table summarizing relative expression of 10 miRNAs across PFC layers I–VI, and underlying white matter (WM) (+++high, ++moderate, +weak, −indistinguishable from background). Note that miR-103/107 probe detects both miRNAs due to a single nucleotide difference at their 3′ end. (I) Double labeled layer III pyramidal neuron from section processed for Neurofilament-H immunohistochemistry (brown) after miR-30a LNA in situ (purple). (J) Bar graphs show qRT–PCR data for miR-30a and BDNF mRNA from dissected tissue corresponding to upper (layer II and III) and lower (layer V and VI) cortical layers from five adult samples (see Materials and Methods) shown as relative ratios (upper to lower). Notice the significant approximately 2.5-fold enrichment of miR-30a in upper layers. Bar in (A) = 200 µm, in (B–G) = 100 µm. Image (I) taken at 63 × 10 magnification.

